This section, after reading the Introduction, is recommended as the starting point for multidisciplinary teams planning to engage in ocean accounting. All members of the team, data providers, compilers and users, should be familiar with the basic concepts and methods.
This section provides guidance on planning for, managing, compiling and using Ocean Accounts. It draws from experience in SEEA[1] implementation and in Ocean Accounts pilots. This experience has proven that developing reliable, quality and relevant statistics benefits from stakeholder engagement throughout the process. If stakeholders agree on priorities and are well-informed about the concepts, they are more likely to contribute their expertise and to use the results.
This section summarizes key components of the Ocean Accounts Framework. Included are the main recommendations on spatial data, asset extent and condition, services supply and use, assessing the ocean economy, governance and indicators.
Ocean accounting builds on accepted international statistical frameworks to harmonize environmental, social and economic data about the ocean. By “ocean”, it refers to coastal and marine areas, within and beyond national jurisdictions. “Accounting” refers to the standardization of data, including maps, so that data collected using different standards (concepts, classifications and methods) can be combined to tell a broader story—often the kind of story that is required to monitor progress towards policy objectives.
The framework (Figure 8) is capable of organizing data in maps and tables on:
Pressures on the ocean (from SEEA-CF),
Ocean assets (extent and condition): ecosystems (from SEEA-EEA) and individual environmental assets (from SEEA-CF),
Ocean services (supply and use): biotic and abiotic (combining SEEA-CF and SEEA-EEA), and
The ocean economy, including but not limited to “Ocean Economy Satellite Accounting” based on the SNA,
Governance: including how the ocean is managed, technologies used, and expenditures made to protect it.
Some aspects of ocean assets and services can be valued in monetary terms and thereby contribute to measures of the ocean economy. However, not all values are monetary or could easily be expressed in monetary terms. The ocean is an important contributor to climate stability, species diversity and cultural heritage. The Ocean Accounts Framework encompasses this broad sense of “values”.
[1] System of Environmental Economic Accounting, a UN standard for integrating environmental and economic data. SEEA-CF is the “Central Framework” and SEEA-EEA is the current “Experimental Ecosystem Accounting” which is undergoing revision for 2020. See https://seea.un.org/. |
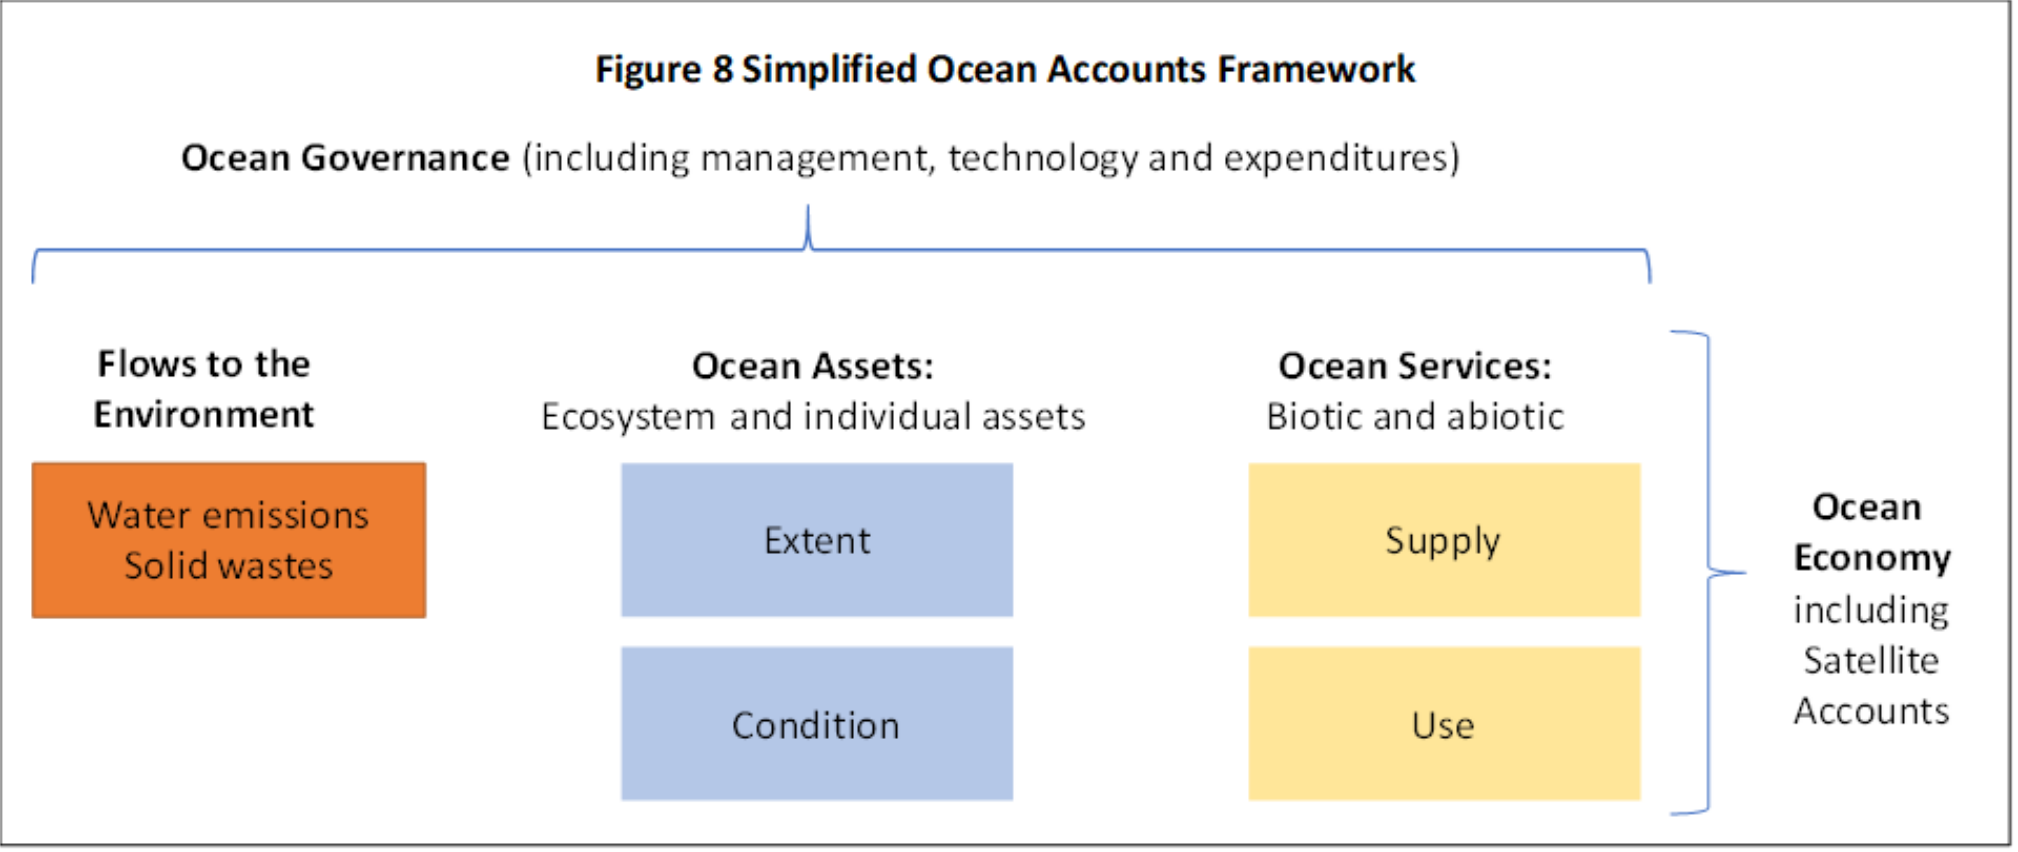
Figure 8. Simplified Ocean Accounts Framework.
Creating a “complete” set of Ocean Accounts would be complex. However, experience in SEEA implementation has proven that (a) accounts don’t need to be complete and (b) to be policy relevant, not all accounts need to be developed. For example, countries have started SEEA water accounts with available data on municipal supplied water. This already proves the relevance of the accounts and attracts support for adding further detail.
What has proven to be essential, though, is strategic planning in preparation for compiling accounts. The Diagnostic Tool for Environment Statistics is a means of guiding a structured conversation among stakeholders to determine which accounts and which parts of which accounts should and can be implemented first. In countries where there is no ongoing institutional mechanism for developing environment statistics, stakeholders consulted during the processes of applying the Diagnostic Tool could be considered the working group. This working group then contributes data, technical expertise and advice to the work as it progresses. Where there is an ongoing institutional mechanism, this could be the main means of engaging stakeholders.
If this working group benefits from the guidance of a senior steering group, it is more likely that resources are made available and that the pilot results will be used to inform policy. The main components of the Diagnostic Tool are as shown in Table 22.
Diagnostic component | Practical actions |
Statement of Strategy and Policy Priorities |
|
Institutions |
|
Knowledge |
|
Progress |
|
Context |
|
Priorities |
|
Constraints and opportunities |
|
The Diagnostic Tool has been designed for use in a workshop setting. However, iteration will be required to achieve consensus. For example, a small core group may draft initial responses and then present them to a larger group for discussion and revision.
The approach applied in the ESCAP Ocean Accounts pilot studies has been to use the Diagnostic Tool outline as the structure of a more detailed scoping report. The scoping report may be coordinated by an independent consultant, the NSO or by a government agency responsible for the ocean. Some countries have found that engaging an independent consultant in producing the scoping report is more likely to reveal opportunities for improvement.
The ESCAP pilots were all initiated by obtaining commitments from senior managers to proceed. Pilots have been initiated in other countries by government experts presenting initial results to policy experts as a demonstration of feasibility.
Most pilot studies have identified data availability and access as major constraints. Even when data are known to be available, they may be distributed across many sources, use different standards and be difficult to access for confidentiality reasons. The general advice is to know what data you have by conducting an inventory of available data.[2] This may be initiated through the scoping process as a request to relevant data holders. Relevant data may also be available from global data sources (see Data sources and platforms for Ocean Accounts). Pilot studies have addressed these constraints in different ways:
using public data: may limit the scope of the study, and data may be difficult to quality check;
establishing data sharing arrangements with relevant institutions: may take time; and
conducting original field work and socio-economic surveys: takes time and resources.
[2] See the ESCAP Environmental Data Inventory Template for guidance on possible metadata that could be collected. |
Most Ocean Accounts pilot studies have used the Scoping Report as input to a first national workshop. This workshop is an opportunity to review the scoping report, revise it if necessary and to agree on the focus of the pilot. It is also an opportunity for capacity building: to discuss related stakeholder activities and to conduct training[3].
[3]Training materials are available on https://www.unescap.org/learning-training. |
When discussing priorities, it is important to understand the broad scope of the Ocean Accounts Framework. Pilots to date have been designed to address topics and policy concerns shown in Table 23 below.
At a national level, addressing any one of the above priorities would be sufficiently challenging to justify a pilot study. However, choosing a smaller, sub-national study area could allow for addressing more than one topic. For example, more information may be available for a specific bay or coastline. Focussing on this as a study area would support a more comprehensive analysis, such as assessing all land-based sources of pollutants in the related terrestrial drainage area, mapping coastal and marine ecosystems and estimating the value of the ocean economy for that area.
Stakeholders may be working with different definitions (e.g., coastal, ocean economy), concepts (values, condition, ecosystem services). Furthermore, some of the important concepts used by one stakeholder will be unknown to others. By presenting related work, stakeholders will better understand the concepts used.
Once participants agree on priority topics, study areas and concepts, they are in a better position to contribute to planning the next stage of work. A work plan should specify roles and timelines to produce the final product. If the final product is chosen to address unresolved policy priorities, it would demonstrate the effectiveness of the framework and attract support for further work.
Topic | Policy concern |
The value of the ocean economy, either broadly in terms of all ocean services (biotic and abiotic) or narrowly in terms of the contribution of non-market ecosystem services | Sustainability of ocean economy, equitable distribution of benefits, including sustainability of food supply (fish and aquatic plants) |
Sustainability of ocean economy, equitable distribution of benefits | National climate change commitments (net carbon emissions), reducing biodiversity loss, improving disaster resilience, |
To consolidate existing spatial information on ocean ecosystems extent and/or designated use as a precursor to conducting marine spatial planning (MSP) | Sustainable use of the ocean, reducing habitat degradation, reducing biodiversity loss, improving disaster resilience, establishing MPAs |
Land-based sources of marine pollution including drainage-basin-level SEEA water, water emissions and solid waste accounts (especially plastics) linked to ecosystem condition | Reducing habitat degradation and biodiversity loss |
Resource requirements (water, energy, land) of coastal tourism and/or the impacts of tourism (waste generation, land use, ecosystem impacts) on coastal ecosystems | Sustainability of tourism economy: providing sufficient resources and minimizing impacts on ecosystems (e.g., closures) |
When substantial progress had been made on the pilot ocean account, most pilot countries have held a second national workshop. This workshop is an opportunity to review preliminary results, to benefit from additional technical guidance and to develop the messaging for a release document. Such a document is important to (a) communicate the results of the compilation, (b) to link it to policy concerns, (c) and to solicit further input on improving the work. The steps for conducting pilot studies are summarized in Figure 9. The process was followed in all five ESCAP Ocean Accounts pilots, which demonstrated substantial results despite the short (6-month) time allocated.
China’s pilot focused on developing harmonised mangrove maps as well as improving the understanding of environmental assets of the mangrove ecosystems in Beihai Bay, one of China’s important marine ecological sites. The results indicated that mangrove areas have expanded from 4.68 km2 to 32.79 km2 over 30 years due to restoration. Mangroves now have an estimated total carbon stock of 0.67 million tonnes.
Malaysia examined food security risk (i.e., fish) along the Straits of Malacca under expected future climate variability. Preliminary results suggested that ocean primary productivity is more sensitive to climate change than to impacts from land, such as runoff of nutrients due to mangrove loss. Nevertheless, reduction in mangrove areas has an impact on landings of particularly sensitive fish species, such as anchovies.
The pilot studies in Samoa, Thailand and Vietnam centred around sustainable tourism by linking tourism income, natural resources use, land-based pollution, and ecosystem impacts – but each country with a different starting point.
Samoa concentrated the pilot on developing for the first time the tourism satellite accounts (TSA) and linked with existing SEEA water and energy accounts. The results showed that in 2018 tourism directly contributed to 12.4% of GDP and 21.5% of employment, while using 11.5% of the water and 10.1% of the electricity.
Thailand, on the other hand, has well developed TSA but no prior SEEA compilations. Thus, the pilot selected the main tourist destinations in southern Thailand (Phuket, Krabi, Phang Nga, Trang, and Satun) as a case study which in total generated 16 billion USD in income in 2016. The study highlighted that although only one in nine persons in the five provinces were tourists, tourism used 21% of the water, 57% of the energy and was responsible for 26% of the waste and 28% of the greenhouse gas emissions. Thailand also started the mapping of tourism potential areas, risk areas and sites for conservation.
For VietNam, the pilot used Quang Ninh province as a case study to develop comprehensive ecosystem accounts with a focus on pollution and tourism. The study found an association between the reduction in mangroves, sea grasses and coral reefs and human-induced factors such as land conversion, aquaculture practices, land-based pollution from tourism and sea-based pollution. Viet Nam plans to extend its pilot to develop a marine spatial plan (MSP) for the province as a policy application using an ecosystem-based approach.
These pilots provide practical examples that demonstrate how the Ocean Accounts Framework can guide the harmonization, standardization, and integration of ocean-related data to inform national policy priorities. They also contributed, through pilot knowledge and evidence, to the ongoing process of improving this Guidance.
The remainder of this section provides guidance on compiling specific components of Ocean Accounts.
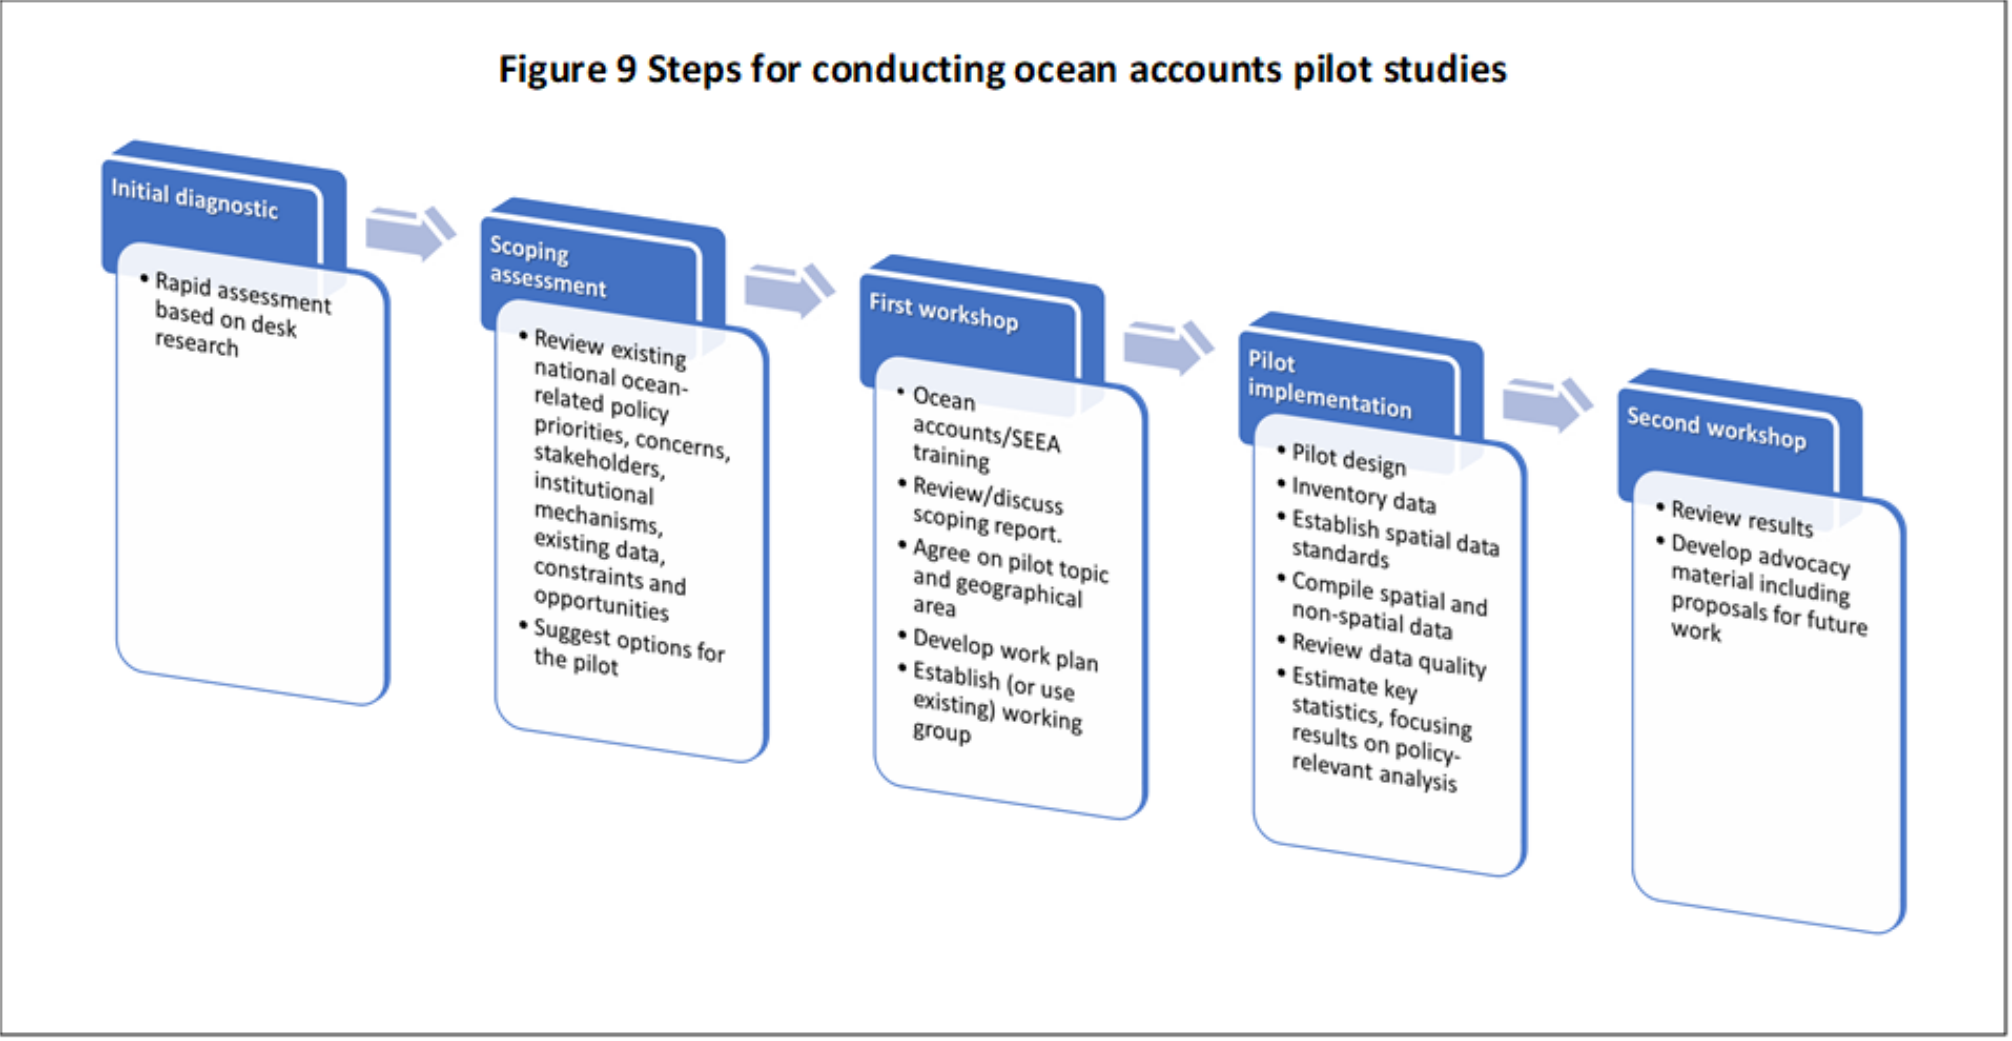
Figure 9. Steps for conducting ocean accounts pilot studies.
Ocean accounts can be built from maps (spatially explicit) or tables (spatially independent), but the power is in combining them. Maps can be used to generate tables and data in tables can be allocated to areas of the ocean.
Establishing the spatial database for Ocean Accounts is an important early step that will facilitate the integration of spatial data from many sources. If the data sources already adhere to the standards of a National Spatial Data Infrastructure (NSDI) (See The spatial data infrastructure for Ocean Accounts) that includes coastal and marine areas (or Marine Spatial Data Infrastructure, MSDI), then spatial standards will not have to be developed specifically for the pilot. If not, then an ocean accounting pilot may be the catalyst to expand an existing NSDI to the country’s EEZ.
Many pilots have begun by compiling maps as a basis for a physical ocean asset extent account (see Environmental asset accounts). If there is no NSDI/MSDI, then standards such as shoreline vector, definition of “coastal”, projections and scales will need to be established. It is possible to generate initial analytical results by overlaying spatial data in a GIS without creating an integrated spatial data infrastructure. However, this does not facilitate the production of the accounting tables. That is, to produce a physical Ocean Asset Extent Account (Table 1), it is best to first align data (e.g., separate maps of mangroves, coral, seagrasses, etc.) using the same shoreline and spatial units. Doing this will ensure validation of the data by revealing gaps and overlaps.
Although the Ocean Accounts Framework suggests spatial units (see the spatial data infrastructure for Ocean Accounts) and ecosystem classifications (see Classification of ocean ecosystems), pilot physical Ocean Asset Extent Accounts typically begin with existing national spatial units and ecosystem classifications.
Including terrestrial and freshwater areas in the spatial database will facilitate the delineation of coastal and other transitional ecosystems. It will also facilitate the estimation of land-based sources of pollution to compile tables on land-based sources of pollutants (see Flows to the environmental accounts (residuals), Tables 10, 11 and 12).
The Malaysia ESCAP Ocean Accounts pilot recommended distinguishing inshore from offshore areas for all accounts, regardless of ecosystem type. This would require agreement on the delineation of inshore and offshore. This could be set at the continental shelf or a specific depth. https://www.unescap.org/sites/default/files/1.3.A.2_Malaysia_GOAP_12-15Nov2019.pdf Canada is testing the use of 1 km hexagonal MBSUs. https://www.unescap.org/sites/default/files/2.2.A.1_Canada__Global_Ocean_Accounting_12-15Nov2019.pdf |
Estimating land-based sources of pollution can be done by (a) allocating national SEEA-CF Water Accounts, Water Emissions Accounts, and Solid Waste Accounts to drainage basin, or (b) in the absence of SEEA-CF accounts, aggregating industry and population by drainage basin and applying per-unit factors. Both require indicators on industry activity (e.g., employment in agriculture, mining, manufacturing) and population by drainage basin. These can be estimated by aggregating spatially detailed data from economic surveys and census of population to drainage basin. Similar techniques may be used to estimate coastal economic activity and population. See Assessing pollutants (flows to the environment) for further guidance.
Tables 10, 11 and 12 also include sources of pollutants by “marine area”, which may be taken as an Ecosystem Accounting Area (EAA) as designated in national marine administration (for example, Figure 10). These should also be part of the spatial database.
National agencies responsible for mapping and satellite imagery may have already established an NSDI (or “One map”) that includes the ocean. However, information on bathymetry may be held by other agencies, such as fisheries or scientific research agencies. Relevant data may also be available from global sources. For example, the USGS/ESRI Global Shoreline Vector and the General Bathymetric Chart of the Oceans (GEBCO) are both recommended for testing.
Basic elements of the spatial data infrastructure include shoreline, bathymetry and the designation of spatial units (i.e., MBSUs based on a grid or other spatial framework), definition of “coastal”, map projection and scale. These then are used to create an initial spatial database (in a GIS) upon which other data are overlaid or estimated.
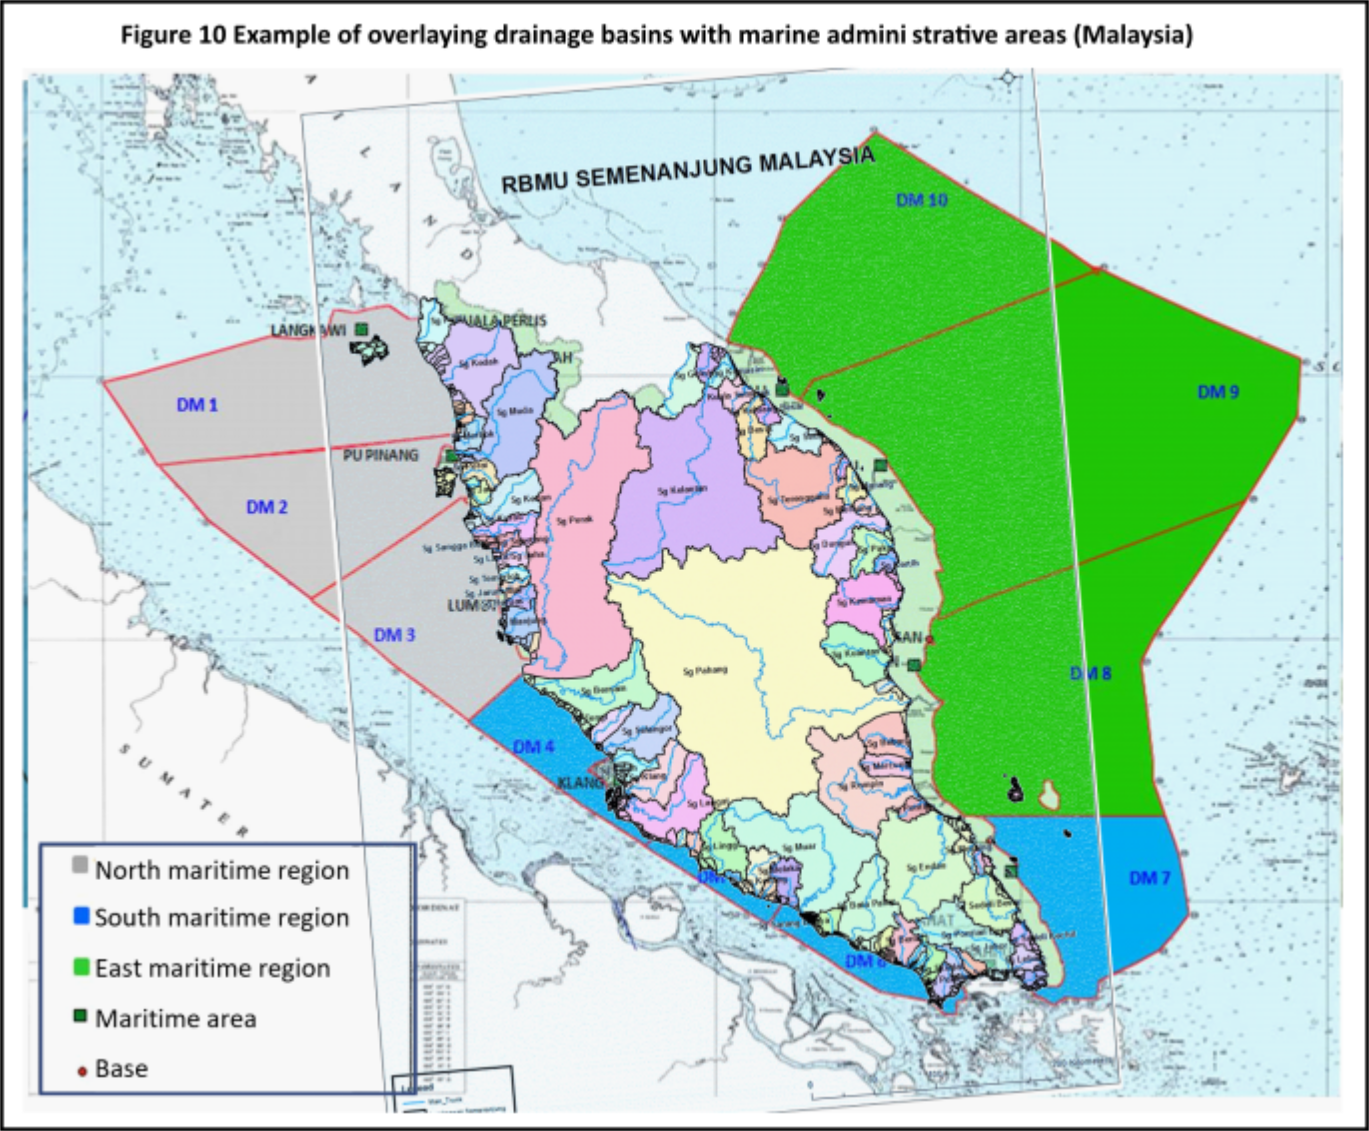
Figure 10. Example of overlaying drainage basins with marine administrative areas (Malaysia). Note: This is a simple overlay of two separate maps and has not yet been integrated into a single GIS database. Internal coloured areas are drainage basins.
The geospatial database could also include climatic (ambient, hurricanes, tsunami, etc.), socio-economic (fish catch, mineral extraction, coastal population, shipping lanes, etc.) and other physical/bio datasets that will help address policy priorities expressed by stakeholders (e.g., risk from storm damage, impact of mineral extraction, sustainability of fish catch). Some of these datasets would be beneficial in linking the framework to concerns of disaster risk and climate change. (See Operational and management decisions).
In a comprehensive Ocean Account, all spatial data would be mapped at sufficiently high resolution to identify assets (including uses), conditions and services of concern. Land and ecosystem accounts are often based on 30 to 250m resolution. This level of detail may not be necessary for Ocean Accounts. Some pilots use a 1km grid, whereas global data may be on a 27km grid or larger.
Having a plan for NSDI/MSDI development, institutional infrastructure and resources in place for update and maintenance will help ensure its longevity and sustainability. Integration of various spatial data sources would also highlight gaps and mismatches that would improve the usability of the source data.
The Viet Nam ESCAP Ocean Accounts pilot integrated UNEP-WCMC’s data on coral reefs and seagrasses with local data on mangroves, ports and protected areas (Figure 11) to assess changes in mangroves, coral and seagrasses with respect to port development, MPAs and shipping routes. https://www.unescap.org/sites/default/files/1.3.A.5_Viet%20Nam_GOAP_12-15Nov2019.pdf The Canada pilot has begun delineating bathymetry, salt marsh, eelgrass and kelp beds (Figure 12). https://www.unescap.org/sites/default/files/2.2.A.1_Canada__Global_Ocean_Accounting_12-15Nov2019.pdf |
Ocean assets encompass not only the living (biotic) components (mangroves, seagrasses, coral reefs), but also the non-living (abiotic) (beaches, rocky shores, minerals, energy), their landform (slope, depth), as well as their designated use (marine protected area, fishing area). Not many countries will have all this information available in spatial detail and in one spatial dataset. However, compiling what data are available nationally will support many analyses of policy interest, including marine spatial planning (MSP). For example, is the extent of mangroves declining? Where are the coral reefs that are at most risk from tourist impacts? Will allowing deep-sea mining impact any unique ecosystems?
Furthermore, understanding the condition of those assets will support the assessment of their capacity to provide ocean services. Condition measures generally refer to quality measures (concentrations of BOD, plastics, pH and temperature), but also to broader measures such as species diversity, ecosystem diversity and “health” of fish stocks). It is highly recommended that measures of condition be compared to a reference condition. For example, BOD concentrations in the study area may be 15mg/l whereas in unpolluted seawater, they are less than 5mg/l. The condition indicator would show that current concentrations are three times higher than unpolluted water.
Linked with the ecosystem extent maps, the assessment of condition will help identify degraded ecosystem assets that would benefit from rehabilitation and pristine ones that would benefit from protection. Compiling data on ocean asset extent and condition would contribute data to Tables 1, 2 and 3.
As described in Monetary Asset Accounts, monetary values can be attributed to some assets by calculating the Net Present Value (NPV) of the future flows of services. This is discussed at length in Chapter V of the SEEA-CF and further guidance on compilation is not provided here. If developing Monetary Asset Accounts is to be attempted as part of a pilot study, it would require reliable measures of service values (See Assessing supply and use of ocean services/inputs to the economy) and agreed scenarios of future flows of those services.
Initial ocean asset extent accounts will begin with national publicly available data and data that stakeholders agree to share. Ideally, this would begin with “official” and agreed (among stakeholders) data on locations of assets of interest and information on their condition. One or more departments (fisheries, environment, mining, energy, natural resources) responsible for aspects of the ocean may have spatial or tabular information that would benefit from consolidation into a “one map” for the ocean. (see Developing a spatial database).
Initial scoping of ocean asset extent accounts should also consider relevant local studies conducted by regional or international organizations, NGOs or academic researchers. In the absence of local data, global spatial portals may provide a useful starting point (Data sources and platforms for Ocean Accounts and Appendix 6.1). However, global data sources should be used with caution for national analyses, since they may be based on generalizations, interpretations or estimates that may not coincide with local conditions.
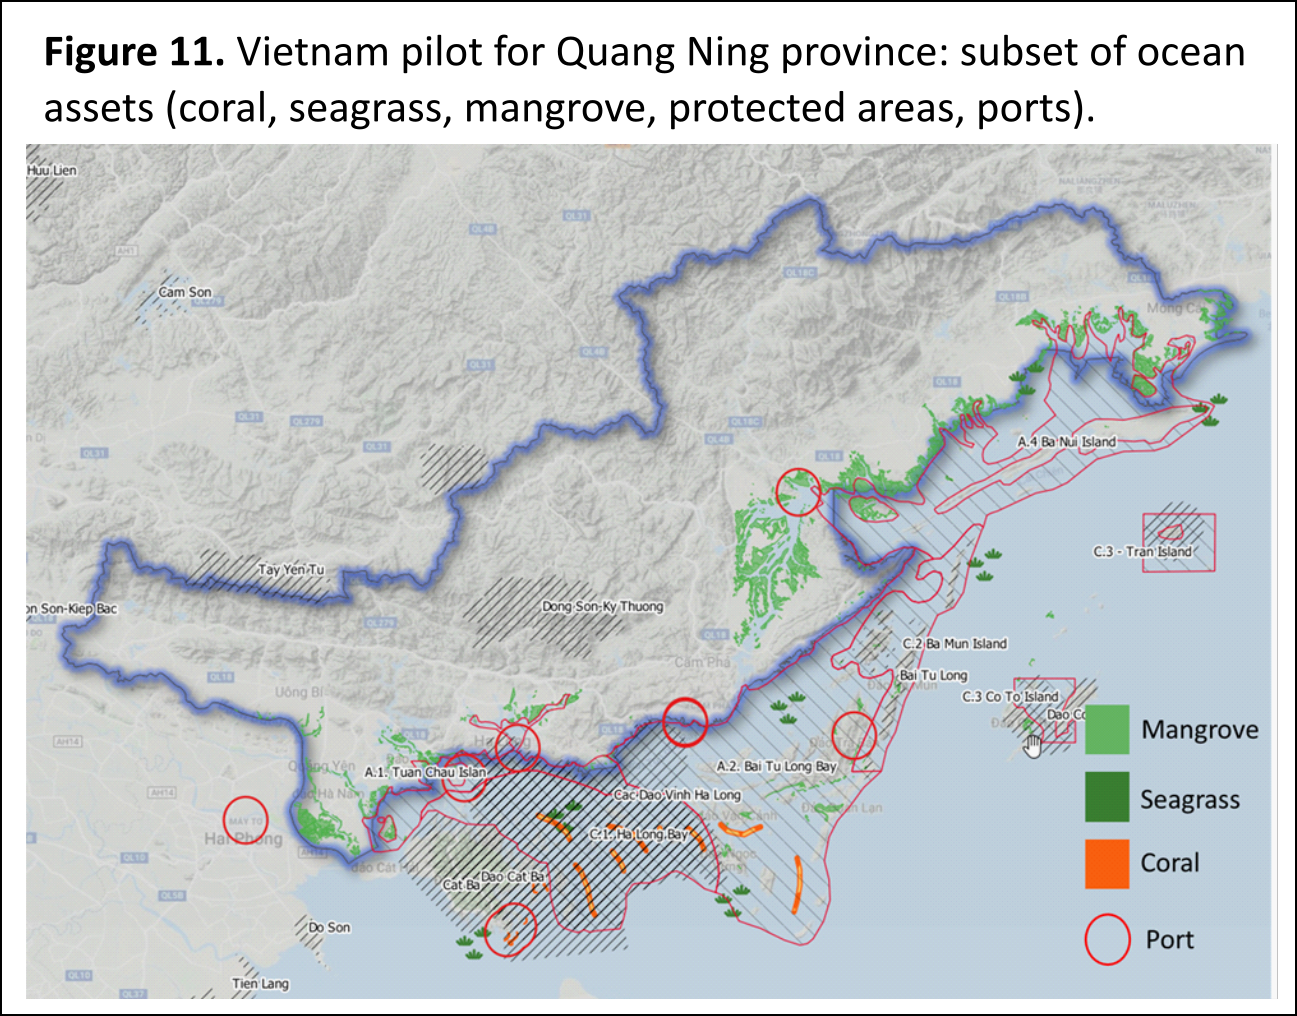
Figure 11. Vietnam pilot for Quang Ning province: subset of ocean assets (coral, seagrass, mangrove, protected areas, ports).
The Ocean Accounts Framework integrates ecosystems (SEEA-EEA) with “individual environmental assets” (SEEA-CF), recognizing that there are overlaps. The overlaps are more of a concern when monetary valuation is conducted, since the value of a seagrass bed would include the value of the commercial fish stocks living in it.
Although this Guidance recommends the IUCN Global Ecosystem Typology (Classification of ocean ecosystem services, Appendix 6.2) as a reference classification for ecosystems., most countries will begin with existing ecosystem types that are of concern and have been studied. National classifications may already be in use and should be applied at initial stages of developing Ocean Accounts. The existing classification may not address all the requirements for comprehensive ocean accounting and, if so, could be further developed in future stages.
Some key ecosystem types for which countries may have information include:
Coastal: beaches, coastal dunes, coastal flats, coastal water bodies (e.g., bays), estuaries, mangroves, rocky shores, saltmarshes, warm water coral,
Marine (to shelf): cold water coral, lagoons, seagrass beds (by type e.g., eelgrass), seaweed, warmwater coral reefs, pelagic (water column) and benthic (sea bottom).
Marine (shelf to EEZ): softbottom/deepwater invertebrate communities (including heterotrophic coral), crustacean habitat, fish habitat, glass sponges, sea cucumber habitat, uninhabited sand, uninhabited rock, pelagic (water column) and benthic (sea bottom)
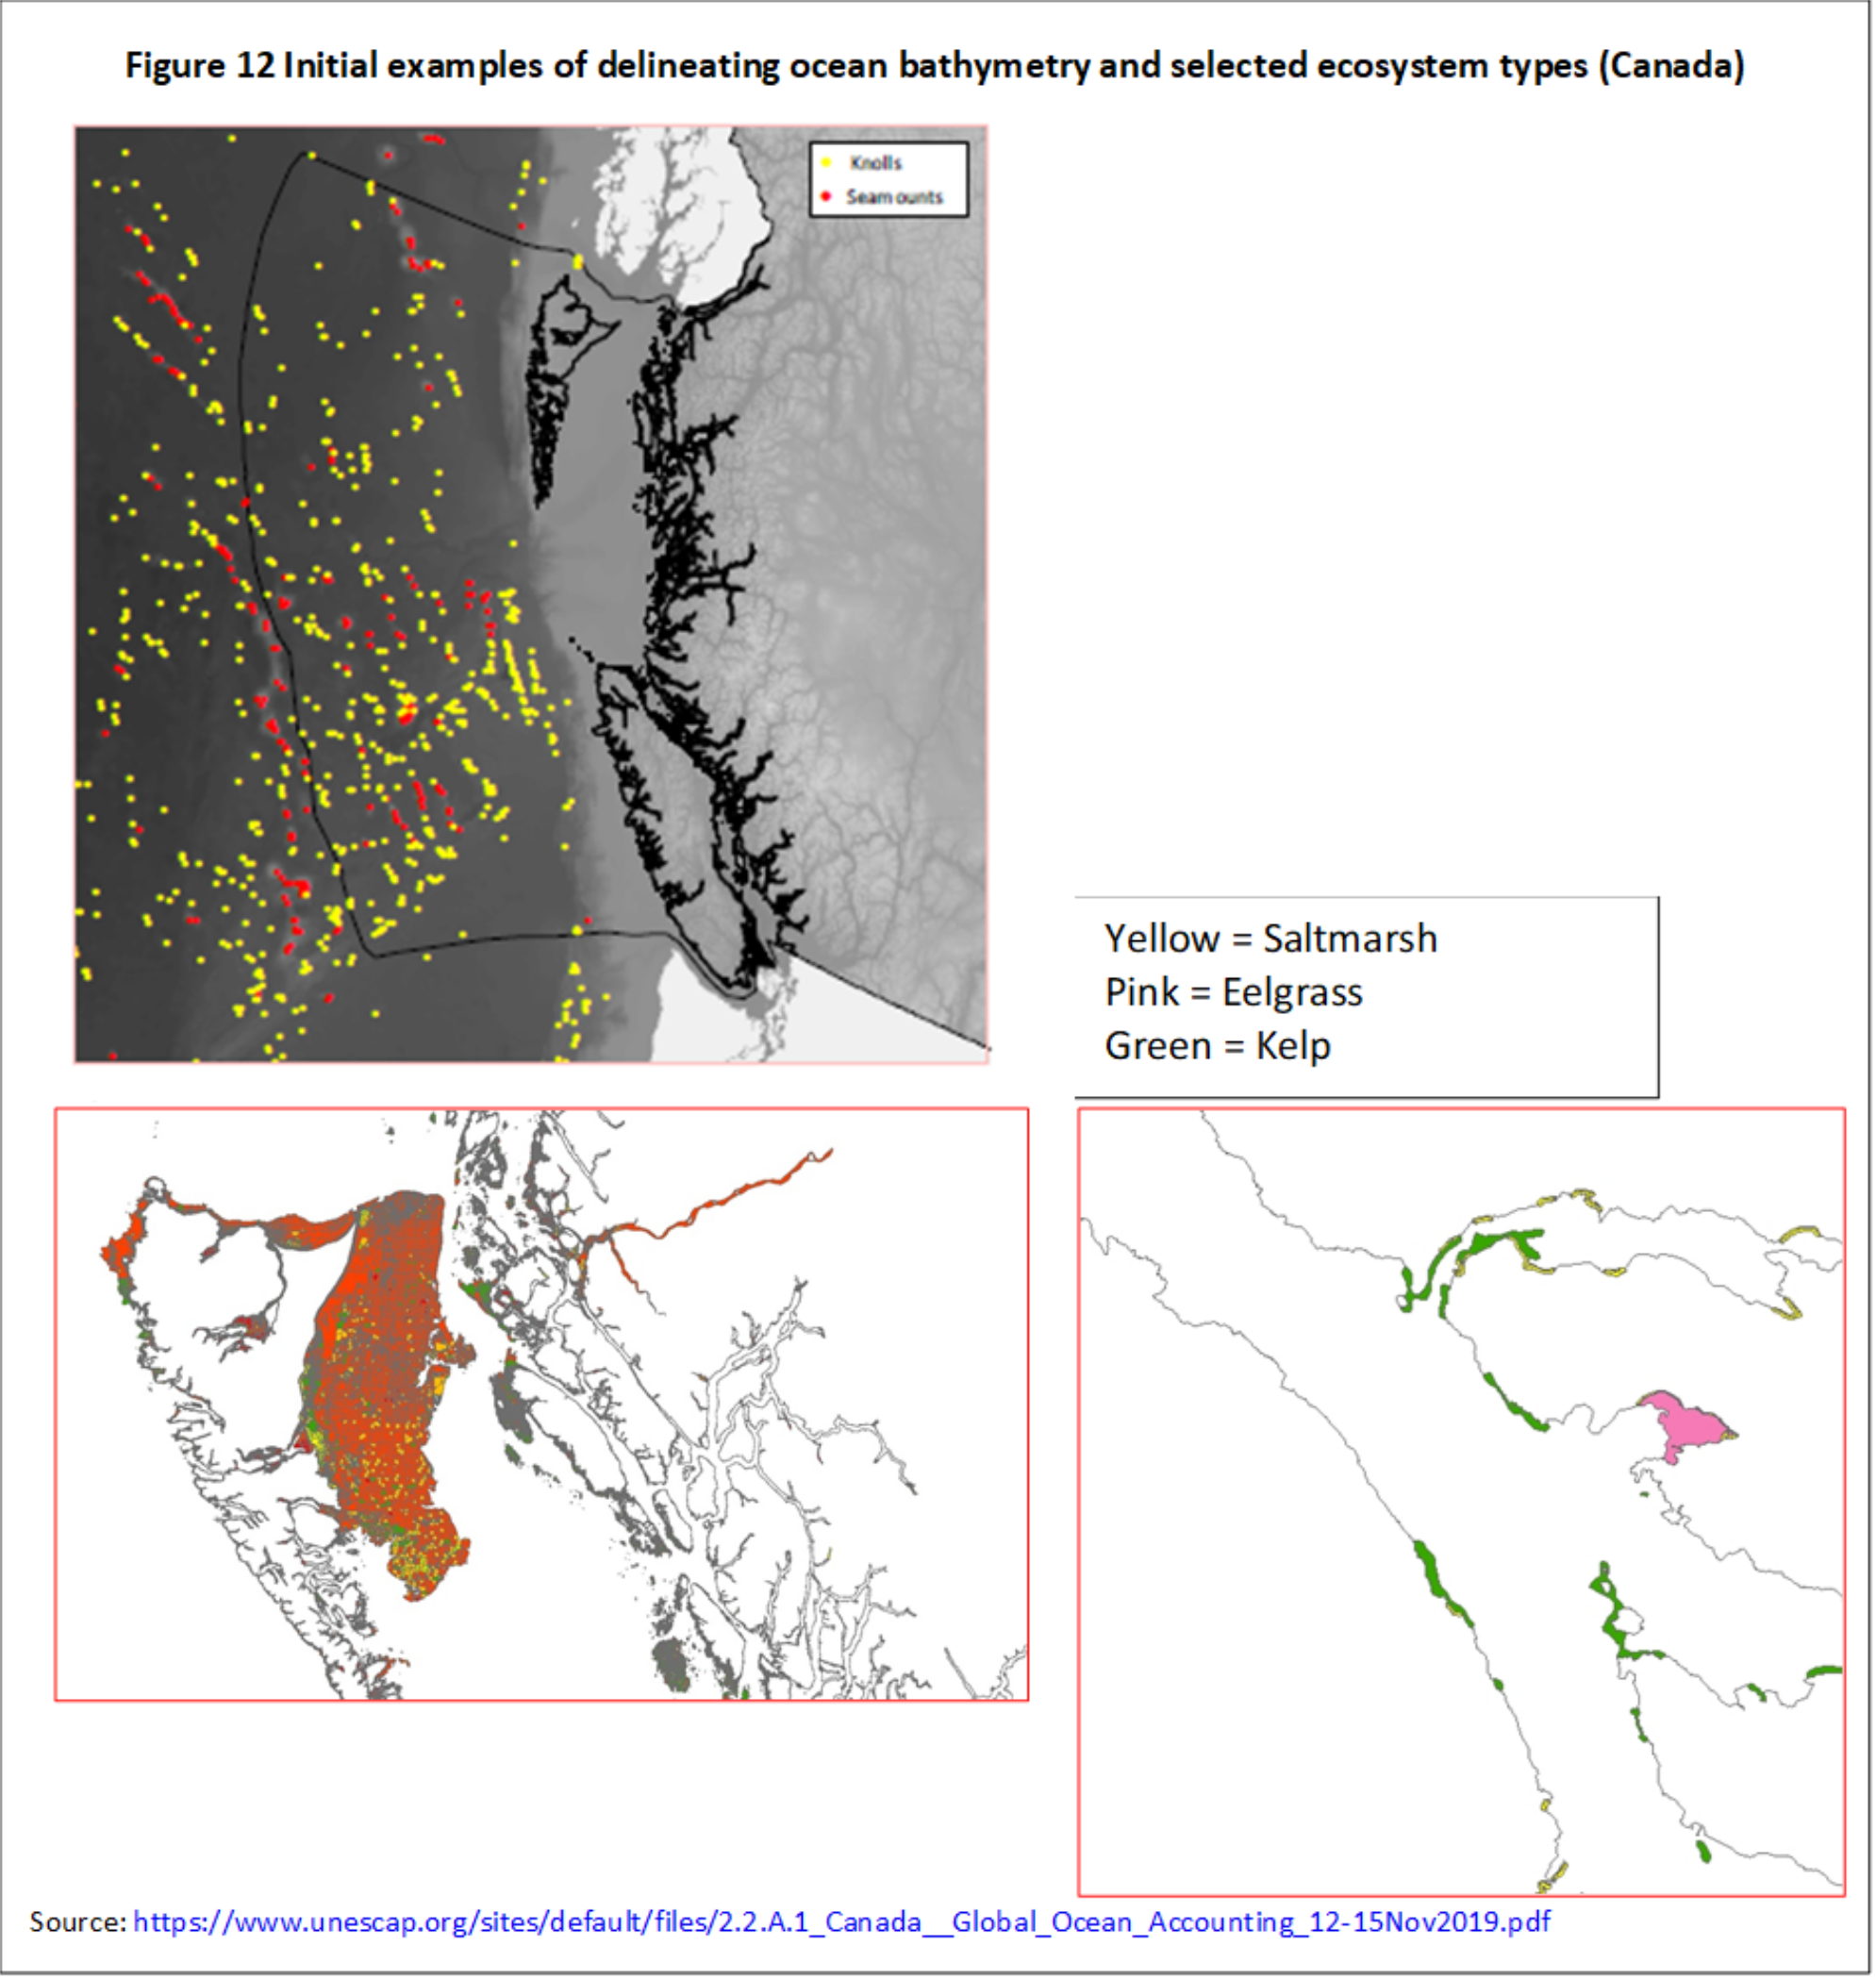
Figure 12. Initial examples of delineating ocean bathymetry and selected ecosystem types (Canada). Source: https://www.unescap.org/sites/default/files/2.2.A.1_Canada__Global_Ocean_Accounting_12-15Nov2019.pdf
Some key uses of coastal and marine areas include: protected area, designated fishing, tourism, minerals, oil and gas, transportation, aquaculture, and energy production.
Individual environmental assets include minerals, oil and gas, commercial fish and crustacean stocks, commercial plant stocks, renewable energy potential (wind, wave, tidal). If these have already been mapped, then the maps could be integrated with the ecosystem extent maps. These may best be produced as a separate map layer and table columns rather than developing a mutually exclusive classification (e.g., seagrasses existing over mineral deposits).
Figure 13 provides an example of overlaying ecosystem asset with designated use. The table counts the number of cells of an ecosystem type (e.g., mangrove) that exist within each designated use (e.g., marine protected area). In this case, 4 cells of mangrove exist in marine protected areas.
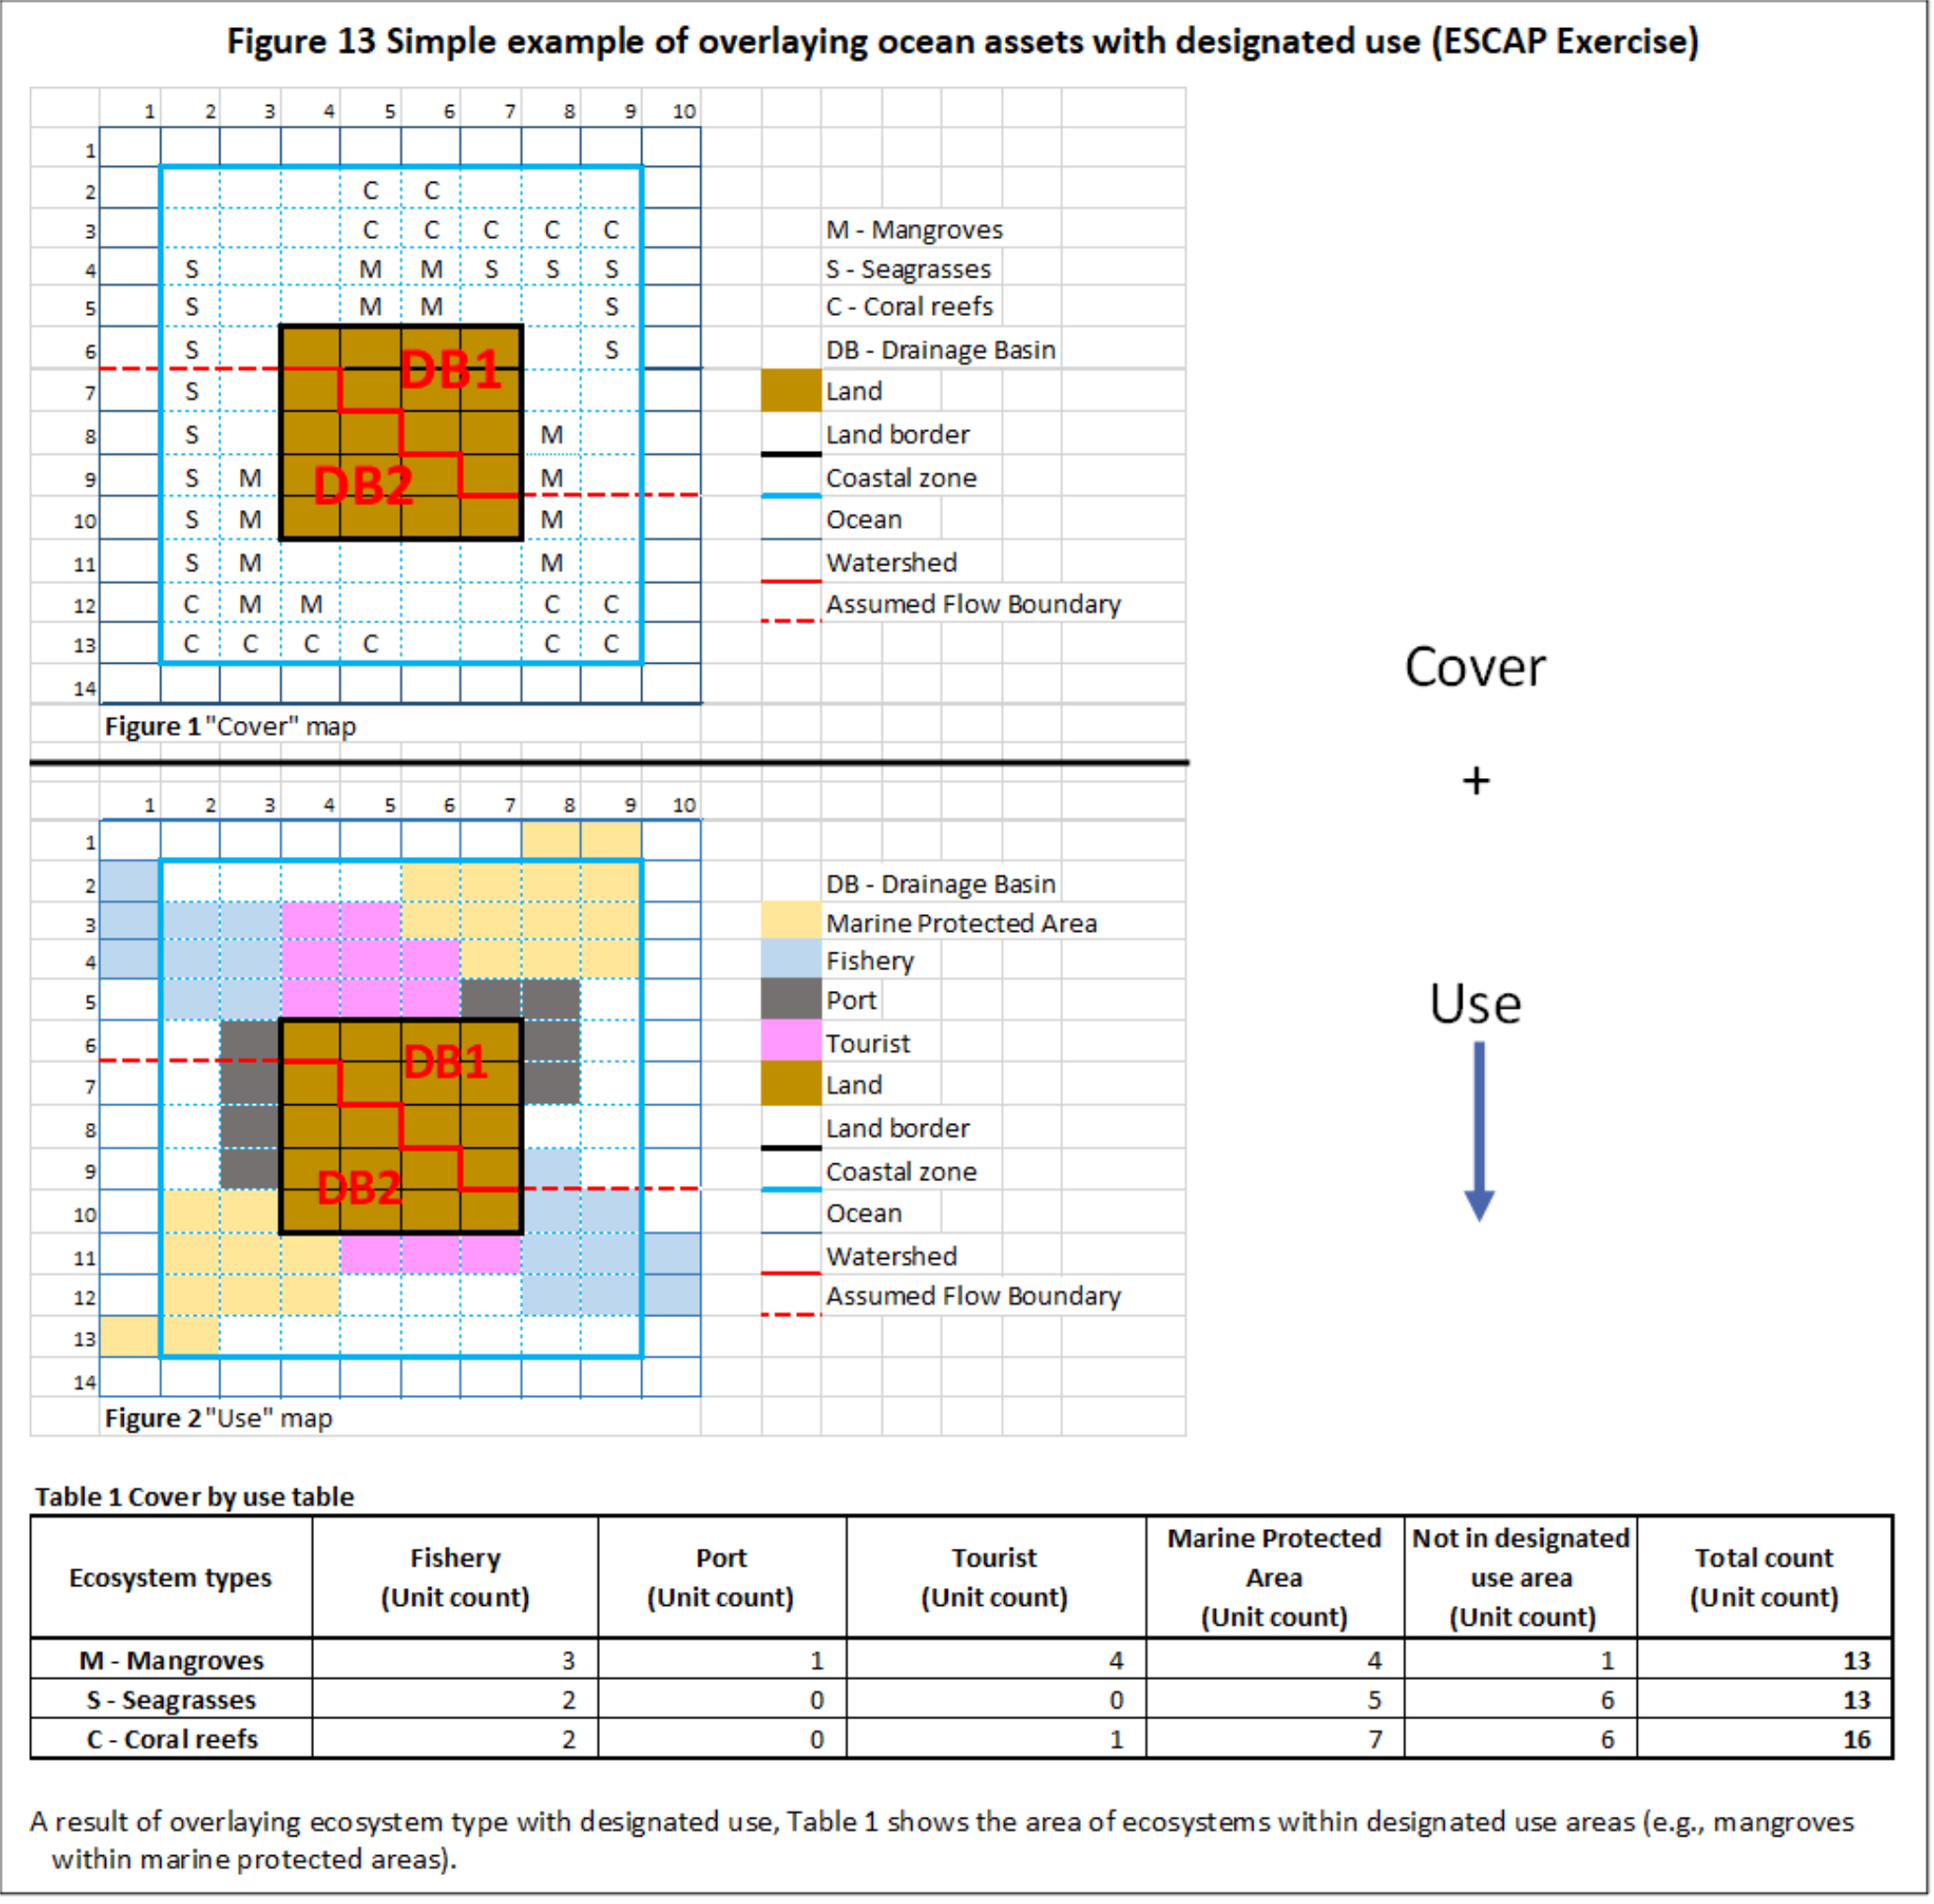
Figure 13. Simple example of overlaying ocean assets with designated use (ESCAP Exercise).
Table X. Cover by use table.
Ecosystem types | Fishery (Unit count) | Port (Unit count) | Tourist (Unit count) | Marine Protected Area (Unit count) | Not in designated use area (Unit count) | Total count (Unit count) |
|---|---|---|---|---|---|---|
M - Mangroves | 3 | 1 | 4 | 4 | 1 | 13 |
S - Seagrasses | 2 | 0 | 0 | 5 | 6 | 13 |
C - Coral reefs | 2 | 0 | 1 | 7 | 6 | 16 |
The choice of condition measures will be informed by national priorities and data availability. For example, data on nutrient concentrations would inform concerns about algal blooms or eutrophication. There are many approaches to “reference condition” and these should be agreed and policy relevant (e.g., pristine, sustainable, specific date in the past, pre-industrial, etc.). Generally, reference conditions should be distinct from “target conditions”, which may be set by policies, but not necessarily consistent with maintaining or improving capacity to provide optimal long-term ocean services.
Some key condition variables that would inform multiple ocean-related concerns include:
pH (acidity)
BOD, COD, Chlorophyll A, primary productivity (an indicator of eutrophication)
Species diversity, ecosystem diversity (Shannon index of diversity)
Concentration of floating plastics
Sea surface temperature (SST)
Coral condition (cover, % living, %bleached)
Seagrass and mangrove cover (%)
Individual environmental assets may also be assessed in terms of condition. Minerals have different qualities (high/low grade minerals) and fish stocks can be “heathy” or “unhealthy”. Representing these in the condition accounts (Tables 2 and 3) would help understand the capacity of those assets to provide services.
A more extensive list is discussed in Essential Ocean and Ecosystem Variables.
Ocean services include both consumptive and non-consumptive use of biotic and abiotic assets. A consumptive service would be the extraction of offshore oil and gas. A non-consumptive service would be the enjoyment of the seascape. Given the many possible ocean services to consider (SEEA-CF natural inputs as well SEEA-EEA ecosystem services), many assessments begin with compiling data on the physical supply and use of the most environmentally, economically or socially significant. Their significance can be informed through the priorities and concerns stated in the Scoping Report.
Physical flows of some consumptive services, largely flows from SEEA-CF “individual environmental assets”, could be estimated from the production of the economic sectors (Ocean Economy Satellite Accounts) that supply them: fish catch, fish from aquaculture, aquatic plants, offshore oil and gas, sand and minerals, biomedicines and energy (wind, wave or tidal). These are measured in the physical quantities in which they are extracted, harvested or captured. Initial estimates would likely be made at the national level but could subsequently be allocated to the sub-national level to establish links to the ocean assets that provide them. For example, sand extraction could be allocated to the coastal beaches from which sand is extracted. Many of these services can be imported, converted into products and used and thereby easily fit into a supply/use structure such as Table 5.
Physical flows of some non-consumptive services can be derived from the extent and condition of the asset that provide them: substrate for transportation by seawater; waste mediation by estuaries; mediation of gas, liquid and gaseous flows by coral reefs, seagrasses, estuaries and rocky shores (includes carbon sequestration and coastal protection); habitats for iconic species, and areas of cultural significance, tourism and recreation by mangroves and open sea. Each of these will have a different set of measurement approaches and conditions under which services are provided. For example, given the types of wastes estimated to flow down the estuary, what proportion will be removed under expected conditions? What ecosystem types and conditions are appropriate for tourism and to what extent are they used?
Allocating the physical flows of non-consumptive services to the entire asset type from which are derived may overestimate the quantity of the flow. For example, if all coral reefs were attributed the equal amount of “tourism services”, this would not distinguish between those that are more heavily used (or overused) than others. Therefore, it is useful to have a means of allocating these non-consumptive services spatially to the portions of the asset that provide a service that is used. This is also useful for designating the beneficiaries of these services. For example, air purification services by mangroves is provided only when there is a population nearby benefitting from that service.
Since these non-consumptive services are generally not imported or incorporated into products, tracking their supply and use focusses on establishing the link between the supply (by ecosystem type) and use (beneficiaries) (Table 6).
Ecosystem services often mentioned in ocean ecosystem service assessments (adapted from Bordt and Saner, 2019) include:
Provisioning
Biomass for nutrition (cultivated and wild animals, plants, algae or fungi)
Biomass for materials (cultivated and wild animals, plants, algae or fungi)
Genetic materials from plants and animals (pharmaceutical products, genetic inventorying and conservation)
Abiotic materials and energy (offshore oil and gas, minerals; wind, wave, solar energy)
Abiotic: seawater as a substrate for transportation
Abiotic: seawater for drinking or non-drinking purposes (industrial cleaning and cooling)
Regulating and maintenance
Lifecycle maintenance and habit protection (e.g., fish breeding habitat, habitat for iconic species)
Mediation of wastes by estuaries (dilution, filtration)
Mediation of mass and liquid flows by mangroves, coral reefs, seagrasses, estuaries, rocky shores (coastal protection from erosion and waves)
Atmospheric composition and conditions (carbon sequestration by mangroves, coral reefs, seagrasses, tidal marshes)
Cultural
Physical and experiential interactions (visits to iconic seascapes)
Intellectual and representative interactions (artistic representation of iconic seascapes)
Symbolic significance of beaches and open ocean (elements that have a sacred or religious meaning)
Further examples are provided in Appendix 6.3.
In principle, many of these services have short-term and long-term economic values. However, if there is a market for the services, their values would already have been captured in the SNA and perhaps attributed to the supplier in an ocean economy satellite account.
It may be best to initially treat the others as non-market benefits and to not value them in economic terms. Consider a stretch of mangrove that protects a coastline from erosion and storms. In a small way, the land being protected may be of slightly higher value with the mangrove (determined using hedonics) since it is at a lower risk from erosion and storm damage. However, the human lives, unique ecosystems and cultural heritage being protected could be invaluable. Tables 24 and 25 provide a case study example of physical and monetary ecosystem services supply tables.
Monetary flow (supply and use) accounts provides an overview of the SEEA Ecosystems revision thinking on valuation. For example, the best methods[4] to use when data and technical capacity are available include:
The service of “fish” is recommended to be valued at the cost of quota/permit fees (rather than the market value of the fish). This focuses on the fishers’ willingness to pay to capture fish and is therefore a proxy for the contribution of the ecosystem to the fishers’ profits.
The service of “carbon sequestration” is recommended to be valued at the current traded value of carbon on carbon trading schemes. If such schemes are not in place, then the “social cost of carbon” (about $50 per ton) could be a proxy.
Other regulating and maintenance services are recommended to be valued in terms of “avoided costs” under the condition that the least cost alternative is less than the willingness to pay. “Avoided costs” of storm damage provided by mangroves are the damages to property avoided by the presence of the mangrove. This requires knowledge of the risk to property with and without the mangroves in place. Willingness to Pay (WTP) is the amount affected people are willing to pay to avoid the damage and needs to be determined separately by survey or interview.
The contribution of ecosystems to “tourism” is recommended to be valued at the fraction of tourism revenue spatialized based on geotagged social media data. That is, the fraction of tourists visiting a specific ecosystem type is determined by their social media activity. That fraction is then applied to total tourism revenues.
The contribution of ecosystems to “recreation” (i.e., nearby use) is recommended to be valued at “simulated exchange value”. That is, as though these non-market services were internalized. This requires estimating demand based on non-market valuation techniques such as asking beneficiaries their willingness to pay for the service. This is then combined with knowledge of the supply and market structure (see Caparrós et al., 2017).
[4] Many of which are described in detail in http://www.aboutvalues.net/method_navigator/. |
The contribution of ecosystems to “adjacent use” (such as reflected in property value) is suggested to be valued using hedonic pricing using a large sample of property sales data to determine the additional prices of properties being adjacent to desirable ecosystems (e.g., coast, beach, coral reefs, pristine protected area, etc.).
Many other valuation methods are in use and should be used in ocean accounting with caution. The SEEA revision process has rejected several methods as risking producing misleading results. These methods include:
restoration costs (restored ecosystems are unlikely to provide the same services as the one replaced),
market prices (for crops, the value of crops includes labour and capital),
travel costs (expenditures on travel are difficult to attribute to the area visited),
stated preference (estimating consumer surplus without restrictions risks gross overestimations), and
unit value transfer without adjustment (benefits transfer is often one by simply allocating the value per hectare from one area to another without adjusting for differences).
Values based on any the above “rejected” methods should not be used in pilots. If national policies or plans have been based on values using these methods, one objective of a pilot could be to re-estimate the values using approved methods.
Initial data will likely be compiled at the national level, since it is at this level that national economic planning is done:
Physical quantities of natural inputs can often be derived from statistical production surveys conducted by the NSO or resource departments. These surveys are usually used to support monetary supply and use tables for the SNA. If data are available only in monetary terms (e.g., the value of fish, sand, oil, gas, etc.), then these can be converted to physical quantities if the unit price is known ($/tonne of fish).
Resource departments often track physical quantities of the resources extracted, harvested or captured within their mandate. For example, many fisheries departments record catches, energy departments record physical quantities of energy (barrels of oil, m3 of gas, MWh of electricity), natural resource departments record tonnes or m3 of minerals, agriculture departments record quantities of aquaculture products.
Spatial detail could be added if maps are available of where these natural inputs are extracted, harvested or captured.
Non-consumptive services that are based on the extent of an ecosystem type, will require maps of those ecosystem types and “factors” to estimate the quantities of services provided per unit. For example, one cubic metre of living mangrove biomass may provide over 200 g of carbon sequestration per year. Applying these factors will require an understanding of how to apply them: some factors refer to the living biomass, others to the total biomass including mud flats. Information on such factors and how to apply them may be available in environment, natural resource or climate change departments.
There are no global databases of such factors yet available. The IUCN provides an overview of relevant tools including modelling approaches.[5] Factors used in individual case studies are embedded in valuation databases, such as the Environmental Valuation Reference Inventory or TEEB Ecosystem Services valuation Database. Such factors are also embedded in ecosystem services models such as those mentioned in the IUCN document. Ongoing efforts in this space include the Nature Conservancy’s Mapping Ocean Wealth and past research on valuation of ecological services across multiple ecosystem types.
[5] The document further recommends http://www.aboutvalues.net/ as a source of additional detail and tutorials. As well, the IUCN recommends the Canadian Ecosystem Services Toolkit. |
Ecosystem service |
Units | Land cover type | |||||||||
Urban | Pasture | Cropland | Forest | Heath | Peat | Surface Water | Other nature | Provincial total | |||
Provisioning | Hunting | kg meat | - | 9,100 | 14,732 | 8,100 | 678 | 70 | 1,513 | 34,193 | |
Drinking water extraction | 103 m3 water | 4,071 | 7,026 | 11,227 | 3,117 | 214 | - | 478 | 862 | 26,995 | |
Crop production | 106 kg produce | - | - | 1,868 | - | - | - | - | - | 1,868 | |
Fodder production | 106 kg dry matter | 533 | 251 | 784 | |||||||
Regulation | Air quality regulation | 103 kg PM10 | 272 | 404 | 717 | 700 | 45 | 7 | 40 | 69 | 2,254 |
Carbon sequestration | 106 kg carbon | 875 | 8,019 | 273 | 50,664 | 393 | 149 | - | 1,056 | 61,429 | |
Cultural | Recreational cycling | 103 trips | 2,690 | 1,863 | 2,611 | 1,565 | 30 | 3 | 139 | 220 | 9,121 |
Measure | Land cover type | ||||||||
Urban | Pasture | Cropland | Forest | Heath | Peat | Surface Water | Other nature | Province total | |
Cover (%) | 23.6 | 20.2 | 33.9 | 15.3 | 1.0 | 0.3 | 3.0 | 2.7 | 100.0 |
Total ES Value (million €) | 4.8 | 18.6 | 61.9 | 19.9 | 0.9 | 0.3 | 1.6 | 4.9 | 112.0 |
Average value (€/ha) | 90 | 412 | 823 | 587 | 426 | 457 | 239 | 814 | 508 |
Standard deviation (€/ha) | 277 | 507 | 815 | 473 | 288 | 135 | 313 | 687 | 655 |
Minimum value (€/ha) | - | 10 | 14 | 56 | 20 | 21 | - | 15 | - |
Maximum value (€/ha) | 2,900 | 3,361 | 4,900 | 3,226 | 1,923 | 653 | 2,906 | 3,186 | 4,900 |
Value public (%) | 99 | 61 | 18 | 96 | 96 | 97 | 100 | 94 | 48 |
Value private (%) | 1 | 39 | 82 | 4 | 4 | 3 | - | 6 | 52 |
Drawing physical ecosystem services factors or monetary values from such databases, models or local studies should be done with extreme caution. Each factor or value is based on assumptions about the ecosystem type, the service being measured, the method being applied and the conditions under which the measurement was made. If the conditions are not well documented, then the measure is ambiguous. Furthermore, each measure has its own inherent uncertainty, which may be large. Reducing the ambiguity and documenting the uncertainty of evidence should be a priority for informing decisions.
If it is a priority to reduce the concentration of nutrients, hazardous chemicals or plastics in the ocean, then understanding the sources of those pollutants will help manage their flows into the ocean. Initial Ocean Accounts could first assess the main ocean pollutant concerns (based on condition accounts) and then select the appropriate flow accounts/tables (see Flows to the environment accounts, Tables 10, 11 and 12) to understand their sources.
If equivalent SEEA-CF accounts (water emissions, solid wastes) are available nationally, then these could be allocated to drainage basin (for land-based sources) or marine area (for marine-based sources), using known indicators of economic activity and population. When allocating SEEA-CF accounts, these indicators are used to calculate the proportions of the pollutants generated in each drainage basin or marine area. For example, agriculture generates 5,000t of BOD and Drainage Basin 1 has 60% of the nation’s employment in agriculture. The initial estimate for BOD generated by agriculture in Drainage Basin 1 is then 3,000t/year (See Figure 14).
If there are no existing SEEA-CF flow accounts, then estimates could be made by applying per-unit factors to the spatially detailed data on economic activity and population. For example, 5,000 people live in Drainage Basin 1 and each person is estimated to generate 0.365t of untreated solid waste per year. Therefore, population in Drainage Basin 1 generates 1,825t of untreated solid waste per year. (See Figure 14)
All untreated wastes in a drainage basin do not necessarily flow to the ocean or if they do, they do not necessarily remain where they were deposited. Further analysis of dispersion modelling would be required for more accurate estimates. However, linking the sources with the conditions is a first step.
Flows to and from other territories may also be of concern. If so, then it would be advantageous for neighbouring countries to conduct similar assessments of flows to the environment.
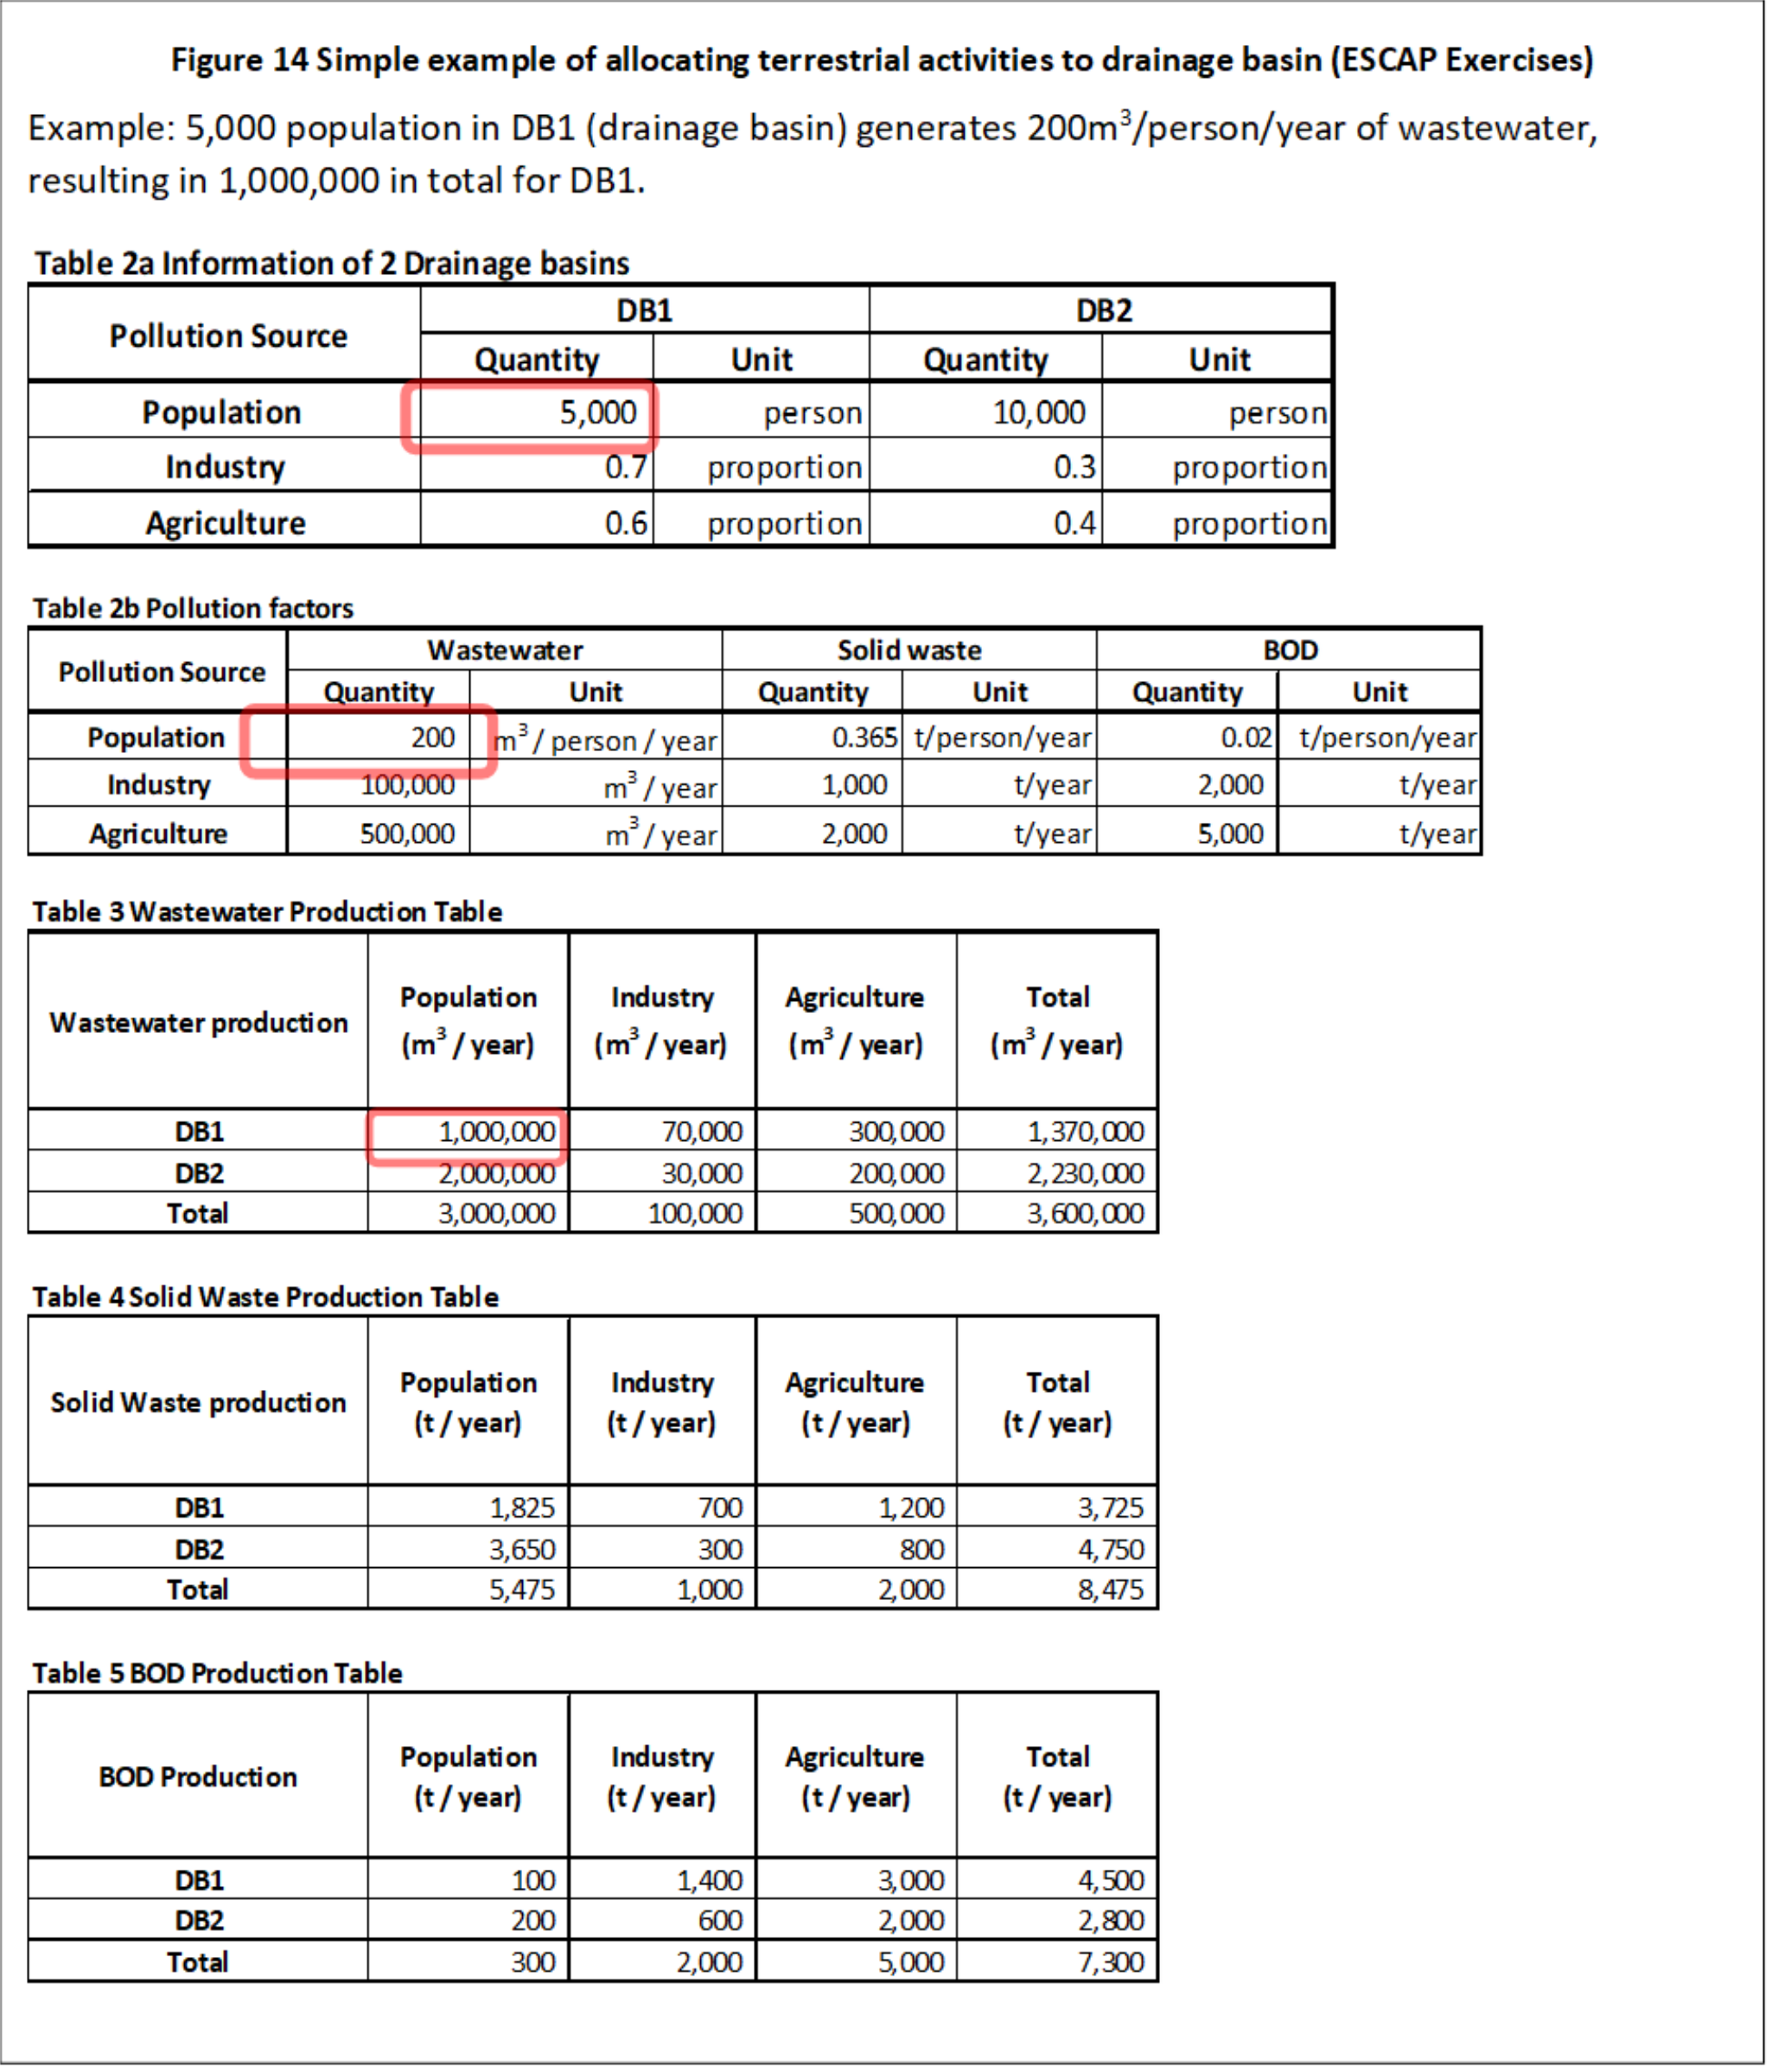
Figure 14. Simple example of allocating terrestrial activities to drainage basin (ESCAP Exercises).
If SEEA-CF Water Emissions Accounts and Solid Waste Accounts have already been produced, they will have used data from multiple sources (water authorities, environment departments). The same sources could be used to compile estimates in the absence of SEEA-CF accounts.
Water authorities may publish reports on the concentrations of pollutants in their outflow and the volumes of that outflow. Concentrations of a substance multiplied by water volume equals the quantity of that substance released. For example, 50ppm (parts per million) of BOD in 100 m3 (tonnes) of wastewater/day would equal 50kg of BOD released per day or 18.25 tonnes per year.
Environment departments or municipal waste management authorities should have data on the amounts of solid wastes generated by households and various industries, and quantities treated and untreated.
Agencies for shipping should have data on amounts of pollutants generated (e.g., in bilge water, oil spills) from marine shipping sources.
Samoa, Thailand, and Viet Nam have included coastal tourism in their ESCAP Ocean Accounts pilot studies. Topics covered include not only its contribution to the economy, but also its requirements in terms of water, energy and land and its impacts in terms of generating residuals and impacts on ecosystems. Thailand and Viet Nam benefitted from existing TSAs in the study areas. Samoa, however, developed a “test” TSA by conducting a case study of about 50 establishments. The case study asked establishments their total revenues, total employment and proportion of their revenues from tourism. These estimates were then used to generate initial “partials” that could be applied to the revenues and employment of the sector as reported in national economic statistics. Similar methods can be used to determine the “partials” of the ocean economy. For example, what proportion of shipping, travel, mining, fishing etc. is attributable to the ocean? |
Countries initiating studies of their ocean economies are advised to begin with identifying the sectors of the ocean economy that are or are expected to be a priority for national development. In many countries, this begins with a focus on marine fisheries, offshore oil and gas, coastal tourism or shipbuilding. The recommended approach to obtain stakeholder agreement on these priorities is to review national plans and policies and engage with stakeholders through the process of developing a pilot project scoping report. The scoping report process should also assess the availability of relevant data, for example as distinct sectors in the SNA or other sources, such as tourism satellite accounts (TSA).
The first step in creating ocean economy satellite accounts is to define the boundaries of the “ocean economy”. The definition should be able to distinguish between ocean-related and non-ocean related activity using indicators, or “partials” that show the portion of activity related to the ocean in any given industry sector. The definition should be consistent with other national economic statistics series so that the ocean portion can be correctly placed into context. It should also be capable of consistent measurement over time so that trends can be identified, and over space so that the measurement of the ocean economy in one part of a country is consistent with measurements in other parts. Adhering to detailed definitions also facilitates comparison with other countries.
In developing the estimation methods for ocean economy satellite accounts, care should be taken to choose approaches that can be regularly replicated. Ocean economy satellite account development is often started with the most easily available data. However, such data may be based on one-time studies of specific industries or ocean assets. Using such data can prevent repeated measurements of sufficient quality to provide useful trends. Surveys and administrative data of sufficient statistical quality are ultimately the most appropriate source.
A detailed definition of the ocean economy is the basis for compiling tables, such as the example provided in Table 13. The characteristic economic activities included by other countries in their ocean economy satellite accounts are discussed in Ocean economy satellite accounts above (Table 14) and other examples are provided in Appendix 6.6.
Tourism, since it is embedded in many sectors (accommodation, food and beverage, transportation) may require the estimation of an initial tourism satellite account (TSA). That is, what proportion of these sectors can be attributed to tourism, especially coastal tourism. For countries with existing TSAs, and with substantial non-coastal tourism, it will be necessary to distinguish between coastal and non-coastal activities.
The focus to date in ocean economy satellite accounting has been on gross value added (GVA, the value of output less the value of intermediate consumption, see OECD Glossary of Statistical Terms) as the principal measure of ocean-related economic activity. As Table 26 shows, the majority of national ocean economy satellite accounts described in a survey by the OECD use GVA as the principal measure of economic activity.
Gross value added (GVA) has several advantages for measuring ocean economic activity. It is additive across industries from very specific industries to very broad sectors. It is also additive from subnational to national levels. GVA permits the ocean economy to be described in terms of different “layers” as China does in its ocean accounts, as depicted in Figure 15 with “core”, “supporting” and “outer” layers.
However, counting only the value added of specified industries in the ocean economy provides a partial view of the role of the ocean in the national economy. A more complete measures is gross output (GO), essentially the total sales of each industry, since GO includes the value of intermediate inputs. It is for this reason that GDP, the broadest measure of annual market-based economic activity, is usually determined by valuation at final demand. That is, the value determined at the point of the ultimate purchaser as defined by four groups: consumption, investment, government, and net exports (exports minus imports). At the point of final sale all the inputs and their value added are accounted for.
GDP or GO has the advantage of breadth of inclusion of all economic activity related to the ocean and all of the inputs to that output, but it may result in double counting the same industry output if reported at the level of detail many countries are using. Value added avoids double counting but misses intermediate input values to ocean industries which are not specifically defined as part of the ocean economy. Both approaches are valid measures of the ocean economy and may be used together; indeed, comprehensive national income accounts should contain both as noted below. Alternately, one approach may be chosen as a starting point. GVA is the most common measure largely because it can most easily be specified by industry within the limits of industrial taxonomies used. It should be noted that the ISIC taxonomy is limited in the industrial detail available, compounded by the fact that national implementation in many countries remains coarse-grained.
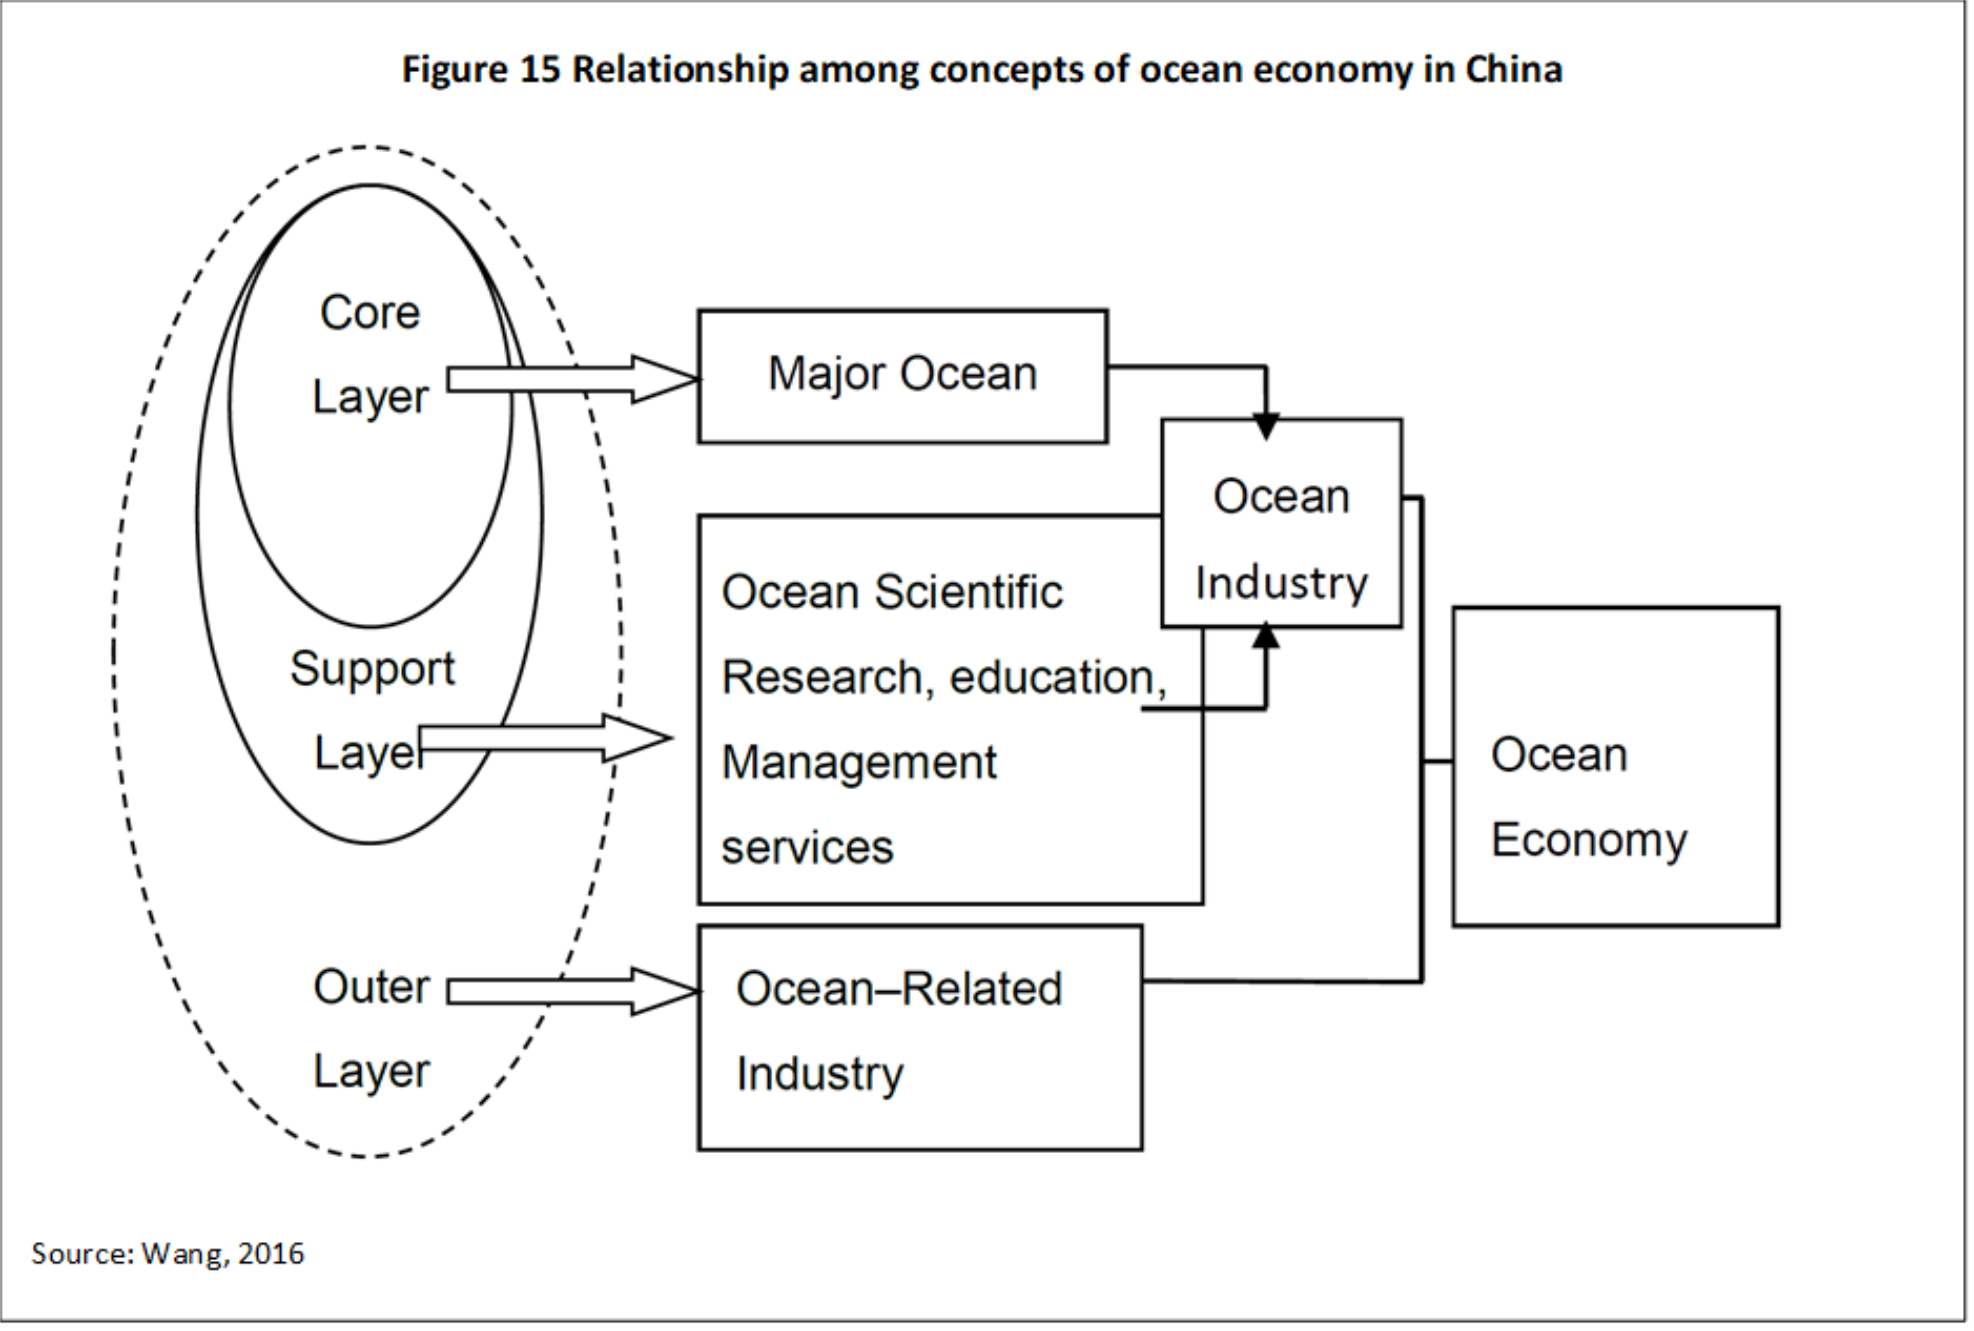
Figure 15. Relationship among concepts of ocean economy in China. Source: Wang, 2016.
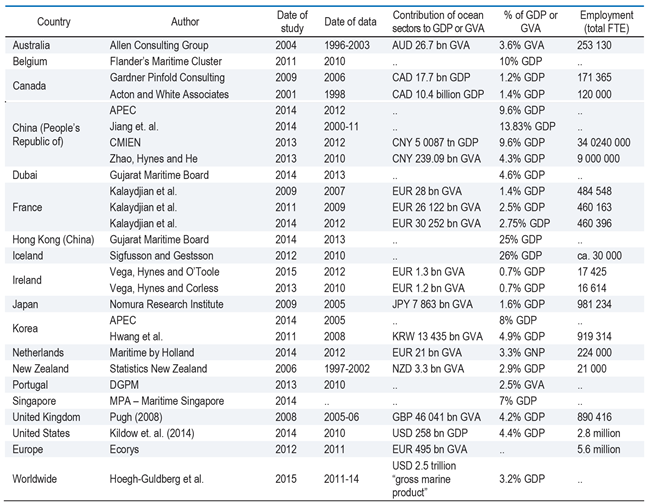
Another distinction between GVA and GO for ocean economy satellite accounts is that GVA involves identifying industries and aggregating the ocean economy up from these. GO requires taking the measures of output measured at final demand and disaggregating down to the ocean-related components. To do this disaggregation requires:
identification of “direct ocean-related industries”
the share of these industries’ output that is ocean related, termed a “partial”, and
the use of input-output tables to measure the complete list of outputs of industries used by the primary ocean outputs.
The designation of “direct” ocean industries, or “core” industries (to use the Chinese term) is a matter of judgment for each country. The coefficient of ocean relationship (termed a “partial”) can be easily measured for some industries (such as marine fishing or transportation, (in which case the partial is 1). But it may be more difficult for other industries such as boat building where boats may be used in inland settings or in ocean settings. In such cases, other data will need to be used; in the boating example, data on boat registrations might be used.
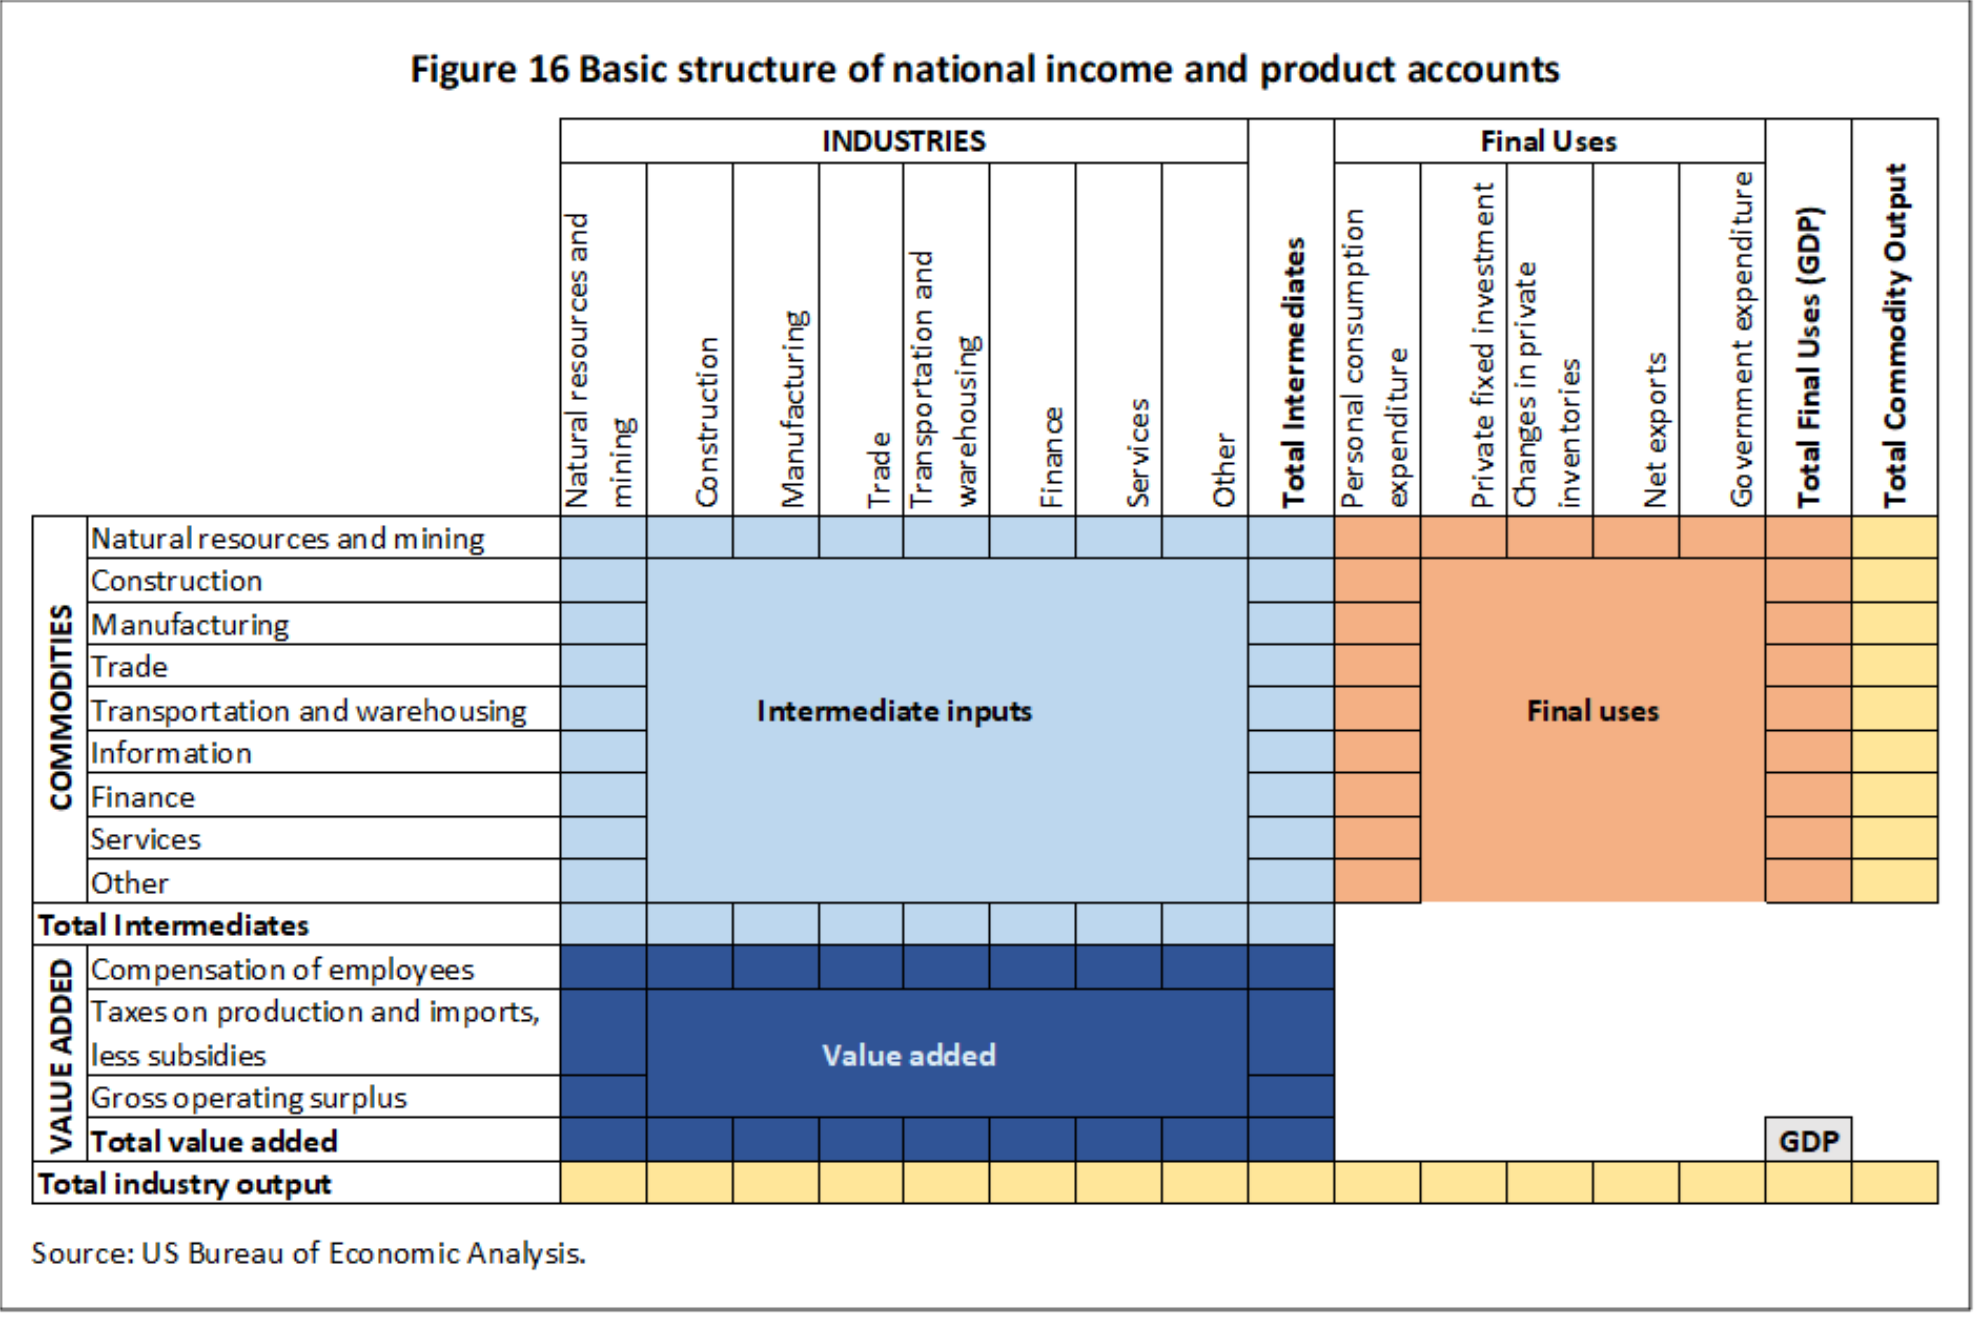
The third element of the ocean-GDP uses the input-output tables. Figure 16 illustrates the basic structure for the overall national income and product accounts, in this case from the United States Bureau of Economic Analysis.
By designating the primary ocean industries in the “Final Uses” section of the table, all intermediate inputs in all industries in that section of the table can be measured; significant improvements in the measurement of the ocean relationship can be realized by also designating ocean relationship coefficients (partials) for these inputs. Note that GVA for industries can also be measured at the same time if value added tables are incorporated in the system of input-output tables.
Constructing the ocean economy satellite accounts within the structure of the I-O tables allows a complete measurement of both the economic activity defined as directly related to the ocean and the complete range of supporting (intermediate) inputs, some of which may be selected for note as part of the ocean economy consistent with the definition selected. Figure 16 uses very broad definitions of sectors, but in the creation of an ocean economy satellite account, more refined definitions are used. In the U.S. case, an I-O table estimated using over 8,000 product groupings are used and a subset of these is selected for definition of an ocean relationship using “partials”.
The use of GVA and Final Demand (the value of output measured at the point of ultimate purchase) addresses the value of ocean economic activity in the current period. Generally, ocean economy satellite accounts are estimated annually, though some countries also provide quarterly GDP estimates, which may include ocean-related components or not depending on the level of effort in measurement of the components of the ocean GDP.
However, current period economic activity is only one part of a comprehensive set of accounts, which should take account of both flows (transactions in a given period) and stocks, or the change in the value of capital (produced) assets between the beginning and end of a period. Changes in the value of capital assets reflect an economy’s ability to accumulate or deplete resources needed for the generation of future flows. In SNA accounting, the changes in the stocks of capital each year are measured as the “private fixed investment”, which identifies additions to capital. Depreciation of capital is also incorporated in the national income accounts to reflect the deterioration of capital such as buildings and equipment. It can also include losses in capital from forces such as natural disasters. This same logic is used in the environmental and ecosystem service accounts to measure positive and negative changes in “natural capital”.
Most ocean economy satellite accounts are not yet identifying changes in produced capital or related financial capital. China is an example of a country which does include an ocean capital account in its system (Figure 17). Integrating produced and financial capital into the ocean economy satellite accounts framework will be an area for future research.
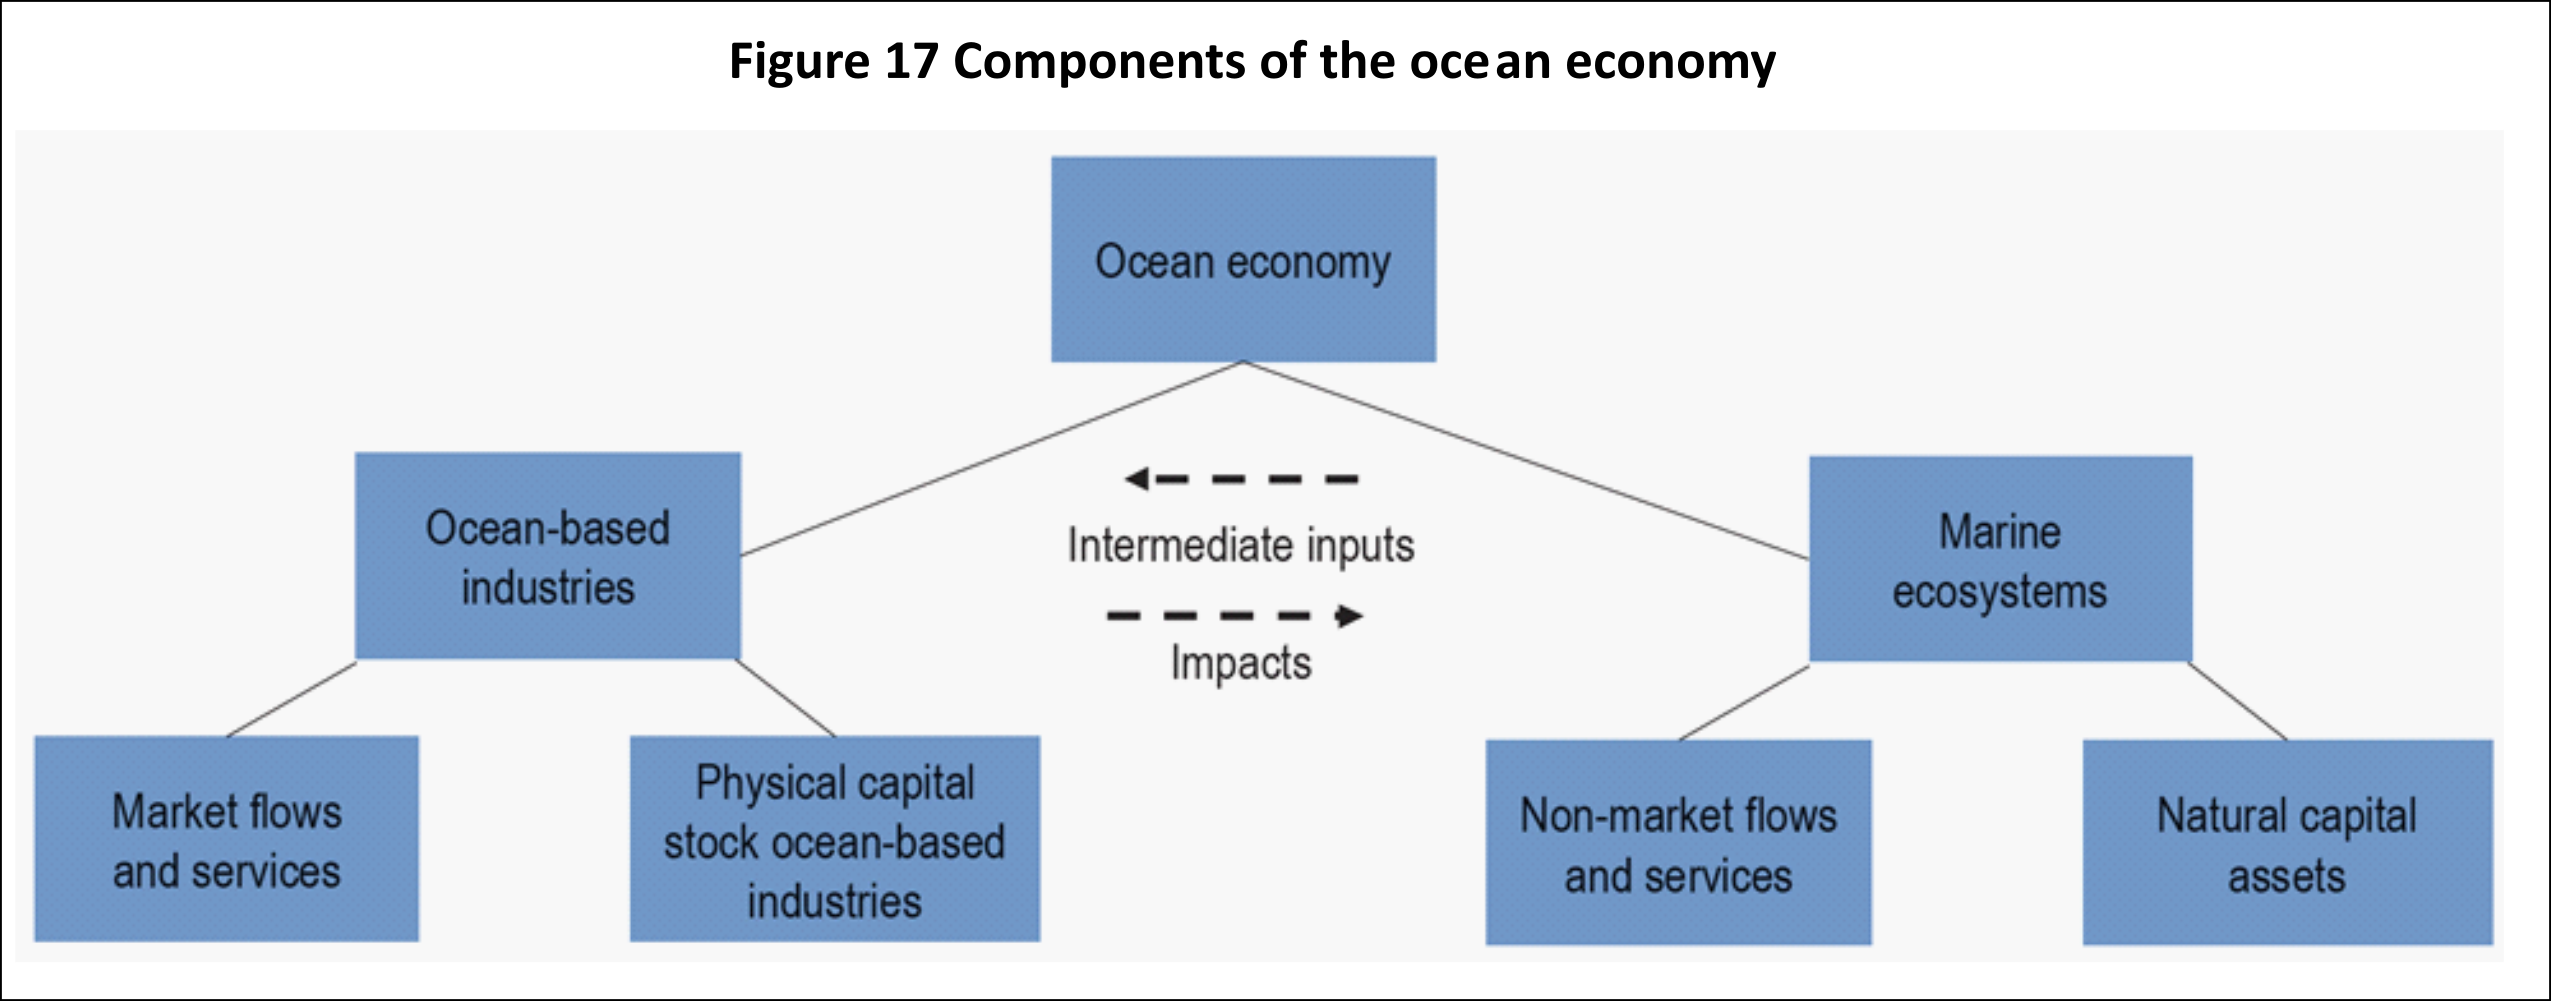
Figure 17. Components of the ocean economy. Source: OECD, 2017.
One additional measure of economic activity that is commonly used is employment. Employment is measured by various combinations of administrative records (for example in the administration of unemployment insurance systems) and surveys of firms and individuals. While output is cumulative over a period, employment can be highly variable within and between periods and is not measured cumulatively. In many ocean industries, such as fishing and tourism, there can be very high levels of seasonality, which are rarely captured in the annual ocean economy satellite accounts. Moreover, employment in many key sectors of the ocean economy is characterized by very different arrangements than traditional employment. Employment is a particularly difficult concept with self-employment and subsistence or non-market employment, a common feature of fisheries in many parts of the world. Particular attention must be paid to the organizational structure (corporations, small proprietors, self-employed) to measure fishing related employment In other parts of the ocean economy such as marine transportation, the employment is recorded in one country (the flag country), takes place in other countries or in international waters, and the wages generated are sent to yet another country.
Ocean accounts provide a basis for addressing the spatial nature of the relationship between people and the ocean in terms of dependence and risks. Social data disaggregated by location and social sub-groups will provide a means of identifying priorities for intervention. It is important to note this section addresses only one aspect of social concerns and disaggregation. Other aspects are discussed throughout the document and can be found, for example, in Section 2.8.6, Section 3.6.1, and the Table in Appendix 6.4.
Information on the contribution of the fisheries industry, derived from economic surveys, will likely already be included in the national accounts. The fishing industry, as represented in the SNA may not cover small-scale and recreational activities and these may require special surveys or estimation from administrative data. Other sectors that may be easily extracted from the SNA include offshore oil and gas, boat and ship building, marine transportation and marine-related construction (such as ports).
The data needed to construct ocean economy satellite accounts starts with each country’s SNA accounts. However, these accounts are rarely well suited to the demands of identifying ocean-related activities. Other data series such as natural resource outputs (value of fish landings), marine transportation[6], or, if available, regional data that permits differentiating between inshore and offshore activities areas such as tourism to be identified can be used. The most rigorous approach would be through surveys of firms either specific to the estimation of ocean economy satellite accounts (the approach taken in China) or an adaption of other economic surveys used to construct national economic accounts.
Developing comprehensive ocean economy satellite accounts requires adding detail to the SNA in terms of economic sectors and commodities. As well, it requires guidelines to avoid double counting, to apply appropriate methods of valuation and to appropriately scope the results to distinguish economic activities in ABNJ.
Specific data sources exploited in the compilation of ocean economy satellite accounts will vary by country. Each country has its own level of detail in the SNA and its own conventions about confidentiality of the detailed data. For this reason, it is highly recommended that initiatives to compile ocean economy satellite accounts be done in close collaboration with the NSO. The exercise could encourage adding detail to existing economic statistics in future years.
As an example of a moderately complex compilation of ocean economy satellite accounts in Canada, Table 27 indicates the data sources used for some of the key sectors.
[6] Assessing the value of marine transportation is complicated by boundary issues, and does not equate to the value of the goods transported (computers, oil, wheat, etc.) Rather, the value of marine transportation is measured in terms of the value added of port services (loading and unloading ships, transferring goods from the marine transport network to the land transport network, storage, etc). The value associated with movement of goods across the ocean can be measured as the value added of shipping companies. The income accruing to these companies are often located in a different country than the port. Labour contributions often come from all over the world. Detailed assessments of the full value added from marine transportation apportioned to the multiple relevant countries are scarce. |
Sector | Data source |
Private sector | |
Fishing and Seafood | |
Commercial fishing | Since regional detail not available from SNA*: Departmental statistics on sea fisheries landings, fisheries management plans, catch data (by province) |
Aquaculture | Statistics Canada Aquaculture Statistics (production survey) |
Fish processing | SNA, export data |
Offshore oil & gas | |
Oil & gas exploration / extraction | Petroleum boards Some sourced from construction and capital expenditure surveys |
Transportation | |
Marine transportation | SNA and customs data on transportation revenue flows |
Support activities | From input-output and customs data |
Tourism and recreation | |
Recreational fishing | Survey of recreational fishing (expenditures); adjusted for saltwater |
Recreational boating | Marine manufacturers association recreational boating report |
Cruise ships | Business association reports |
Coastal tourism | Estimated from Statistics Canada travel survey |
Manufacturing and construction | |
Shipbuilding and boat building | SNA |
Ports and harbours construction (public) | Government financial reports |
Public sector | |
Federal and provincial government | Marine-related and coastal expenditures derived from financial reports (removing contributions to marine-related transportation and construction) |
Universities | Ocean-related grants plus expenditures of coastal universities |
Environmental non-governmental Organizations (ENGOs) | Financial data of representative ENGOs |
"Governance” refers to the ways in which individuals and institutions manage their common affairs. The ocean is a common asset and managing the impacts people have on it requires an understanding of the norms, institutions and relationships involved.
The basic outline of ocean governance should already be included in a national Diagnostic or Scoping Report. Relevant components of the Diagnostic Tool (Prioritisation and account development planning) record information about:
Statement of Strategy and Policy Priorities: The “norms” as encoded in:
the national vision, as stated in the constitution or national sustainable development plans and strategies
relevant policies, including sector-specific (e.g., and ocean policy, strategy, MSP or ICZM) or related policies: sustainable development strategy, national biodiversity strategy and action plan (NBSAPs), multilateral environmental agreements (MEAs), Nationally Determined Contributions on climate change (NDCs), Voluntary National Reviews on SDGs (VNRs), sustainability concerns, such as problems that need to be resolved or avoided in the future
Institutions and their mandates and data holdings related to the ocean: There may be one institution responsible for coordinating government activities on the ocean or the responsibility may be spread across many agencies. NSOs may see their stakeholders as “data providers”, but users and affected stakeholders and international agencies also need to be considered.
Relationships, including institutional mechanisms and data sharing arrangements: There may be senior committees or technical working groups with the mandate to coordinate information and actions on the ocean. Coordination mechanisms responsible for sustainable development or environment may also have responsibility for the ocean.
Ocean Governance Accounts suggests codifying this information spatially and by sector; that is, to what areas of national waters and which sectors do specific mandates, information holdings and coordination mechanisms apply. This would be an opportunity to assess whether all national waters are covered by relevant mandate.
Reviewing relevant policies will help understand (a) whether the policies are coherent with the national vision and development goals, (b) whether they address the stated concerns about the ocean (e.g., overfishing, pollution) and (c) what data are required to monitor and report on their targets.
Reviewing stakeholder data holdings, using the ESCAP Environmental Data Inventory Template will help understand the nature of the data available in terms of topic, coverage, quality and accessibility.
Combining these reviews of policies and data holdings will begin to identify gaps in both. Are the policies addressing the concerns? Are data available to monitor and report on the policy targets? ESCAP’s EPIC (Every Policy is Connected) tool suggests a collaborative process for identifying such gaps. ESCAP is also testing a tool for Accelerating Implementation of SDG14 by identifying and addressing gaps and bottlenecks in policies and institutional mechanisms.
Such analyses could help identify priorities for a pilot study. For example, in Samoa and Thailand policies were in place to increase the benefits from tourism. The pilot studies began to assess the resource requirements and impacts of tourism to develop analyses of possible future scenarios. For example, if tourists generate four times the waste of residents, what infrastructure would be required to manage waste from twice the number of tourists?
Assessing governance also means measuring the effort put into monitoring, managing and mitigating impacts on the ocean. A country could have many extensive plans in place, yet not have enough people and funds to implement and monitor them. The SEEA-CF provides guidance for measuring environmental protection expenditures (summarized in Table 16). The FDES (Appendix 6.4) suggests recording the number of employees engaged as well.
Many national and institutional constitutions, policies, plans, priorities, strategies are posted online, but ongoing processes, such as discussions on an ocean strategy, may not be readily available. Also, departmental mandates and data holdings may be online.
Information on ocean governance may already be summarized in an NBSP, State of the Environment Report (SOER), FDES compendium or VNR (Voluntary National Review). If the NSO is engaged in SDG reporting, they should have an overview of national data holdings related to the ocean.
ESCAP has produced an assessment of SDG14.2.1 (Proportion of national exclusive economic zones managed using ecosystem-based approaches) in terms of progress in MSP by coastal member States in Asia and the Pacific. It includes detailed information on national MSP and ICZM-related activities, policies, plans and strategies. IOC-UNESCO provides a more summary, global assessment[9].
The outputs of an ocean accounting pilot study will most likely include several detailed tables on ecosystem extent, condition, and services with respect to the issue and study area being addressed. However, providing policy-relevant summary indicators will ensure that the results of the study are easy to communicate. Part of this communication should also include an assessment of data quality and availability. The detailed tables and databases used to produce the Ocean Accounts will serve to “drill down” into the locations and specific measures underlying the summary indicators. This would contribute to the compilation of tables in Combined Presentation and Ocean Wealth Accounts, such as Tables 19, 20 and 21.
The summary indicators should address the topic of the study and put the study in context.
The Framework for the Development of Environment Statistics (FDES) also provides recommendations on several ocean-related indicators as part of the overall framework measuring the state of the environment, our dependence on it, our impact on it, it’s impact on us and what we are doing to manage those impacts. See Appendix 6.4 for a detailed list of these indicators.
Topic | Summary indicator | Context | Quality concerns |
The value of the ocean economy | Annual production value by resource type (market vs non-market) and ecosystem type; Resource values at risk (cost to economy of no action on rehabilitation or protection of key ecosystems) | Proportion of value of national economy · Possible economic losses (in % of GDP) if ecosystems not rehabilitated or protected. Possible impacts on target populations (low-income, small-scale fishers) | Estimations required; valuation methods used |
Non-market ocean services | Physical measures of regulating and maintenance services (coastal protection, flood mitigation, carbon sequestration, water purification, etc.) | Proportion of essential ecosystem services provided by the ocean (i.e., compared with terrestrial assessments); | Applying one factor to ecosystem types of varying conditions; Appropriateness of global factors used to value local ecosystems; |
Ecosystems extent and/or designated use | Area of ecosystem types and uses of concern; Change in area (e.g., decline in mangrove; increase in MPA) | Proportion of national EEZ (e.g., MPA) | Areas where ecosystem type is unknown; Uncertainty in maps (resolution, inconsistencies); Vintage of data |
Land-based sources of marine pollution linked to ecosystem condition | Most significant location and industry of pollutants of concern; Condition of ecosystems affected by pollutants of concern; | National proportion of unmanaged pollutants; Proportion of land-based pollutants flowing to ocean; Locations and extent of pristine and degraded ocean ecosystems. | Estimates of pollutants based on proportion of economic activity or population. Availability of data on condition of marine ecosystems. |
Resource requirements and impacts of tourism and other marine-based sectors such as shipping, fisheries and mining | Resource requirements of current and planned tourism (water, energy, land); Current and probable impact of ocean tourism (waste, habitat degradation); | Value of current and planned tourism with respect to overall economy; Resource requirements and impacts of alternative forms of tourism (cultural, agricultural, urban) | Estimating resource requirements and impacts of tourism based on small-sample surveys; Distinguishing ocean tourism from other tourism; |